RIFFLE stands for Remote Independent Field Friendly Logging Electronic. This version of a RIFFLE measures air and water temperature using an Arduino, and it is designed to be placed near a stream, creek, river, or lake. It collects timestamped data every couple of seconds and saves the data to a Micro-SD card. The large data set produced by the device is compatible with spreadsheet programs like Google Sheets. If built and implemented correctly, RIFFLE users can mathematically analyze and graph changes in water-air temperature like scientists in formal studies.
This tutorial describes how to wire, code, and build a version of a RIFFLE that’s designed for elementary students. It also contains an overview of how to mathematically analyze and graph collected data with Google Sheets. Not included are instructions about how to protect the electronics in the field, an important consideration that should be addressed before using the RIFFLE.
The intended audience for these instructions is elementary teachers, students, and people with little experience wiring circuits and programming Arduino microcontrollers.
Materials
The following items are necessary components in this RIFFLE. Only one of each is necessary for building a single device, but it is often cheaper to buy in bulk from places like eBay. Some of the links point to purchasing sites for multiple items, so adjust accordingly.
The tools below are used to modify the DS18B20 OneWire Temperature Sensor to interface with the breadboard.
- Wire Strippers
- Electrical Tape
- Soldering Station
- Solder
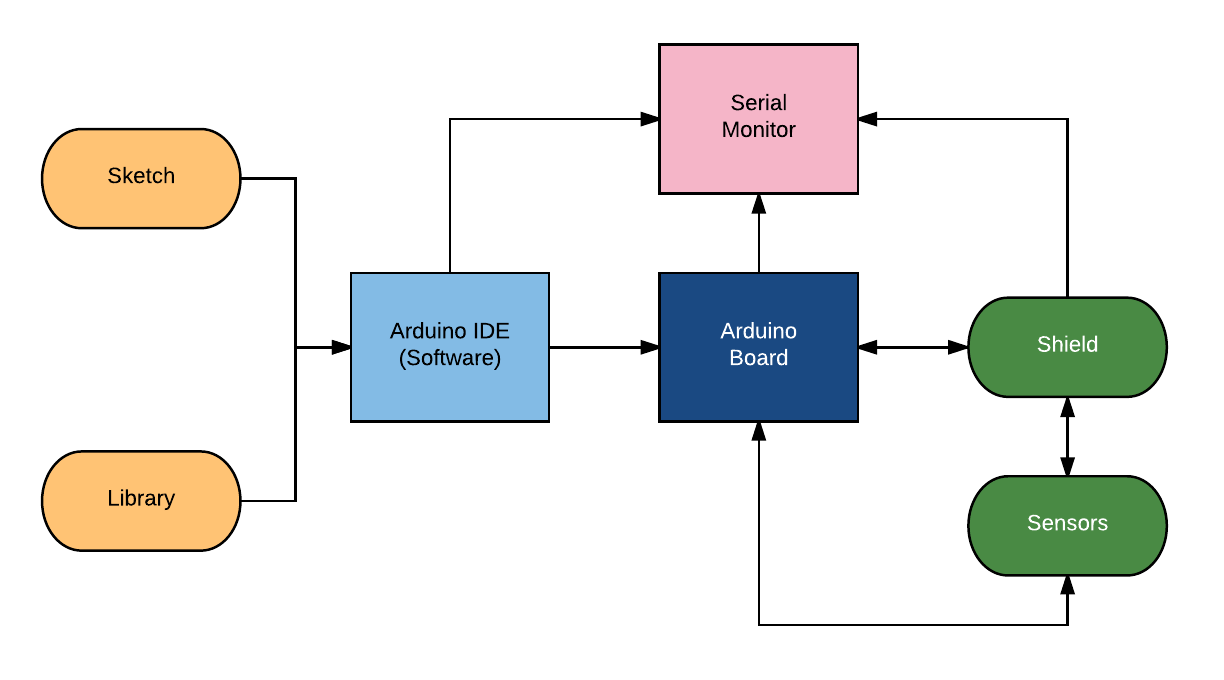
Arduino Background Information
Sketch: The name that Arduino uses for a program. It contains code that is manipulated and sent to the Arduino board. Learn More
Library: Background code that provides extra functionality for a sketch like controlling sensors or peripherals. A library is downloaded and included in a sketch but is often left alone. Learn More
Arduino IDE: IDE stands for Integrated Development Environment. The Arduino IDE is the most commonly used open-source software for programming Arduino boards. Download
Arduino Board: The microcontroller consisting of a processor, CPU, I/O, and memory. The Arduino Uno is the most popular, but there are others with more/less functionality. Learn More
Serial Monitor: An Arduino board communicates with the computer (USB) or peripherals like LCD screens (UART) through a serial connection. The serial monitor sends and receives messages, and it acts as a “window” for ongoing processes (e.g., viewing temperature readings from a connected sensor). Learn More
Shield: Small boards that attach to the top of an Arduino board. Shields add functionality but are not used in this project.
Software Configuration
The Arduino IDE is the software for creating sketches and uploading code to Arduino microcontrollers. IDE stands for Integrated Development Environment.
Download and install the most recent version of the Arduino IDE. The Arduino IDE is what is used to send the sketch (code) to the Arduino in the instructions that follow.
Arduino-Computer Connection
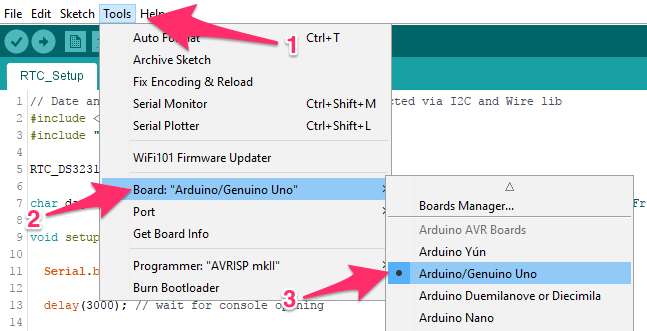
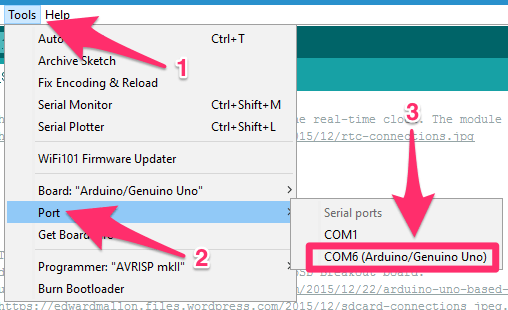
Arduino microcontrollers are not plug-and-play with the Arduino IDE. The Arduino IDE needs to know the type of Arduino microcontroller (board) that’s being used, and it also needs to know where to find the specified Arduino (COM port).
1 Connect the Arduino UNO to the computer with a USB cord. If prompted by the computer, wait for Device Setup to install any necessary drivers.
Note
Downloading CH340 drivers is required when using Arduino clones manufactured in China. Genuine Arduino products do not require this additional step. With the Arduino connected to the computer via the USB cord, download and install the CH340 driver. Follow the instructions on Github and then restart your computer.
2Open the Arduino IDE on your computer. Go to Tools and then Board. Choose Arduino/Genuino Uno.
3Go to Tools and then Port. Choose COM?. The com number will vary depending on the computer, but it’s usually not COM1. The correct port may or may not say (Arduino/Genuino Uno).
Note
If you only see COM1, there’s a large chance that the computer is not recognizing the Arduino. Go back to Step 1 and download the CH340 driver.
4Run any updates if prompted by the Board Manager or Library Manager. The Arduino IDE displays a message in the lower-left corner of the screen when updates are available.
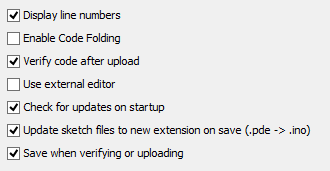
5Go to File and then Preferences. Check all of the boxes that appear in the image below. Click OK when finished.
Library Installation
There are a number of libraries that are necessary for the RIFFLE to work properly. Libraries contain background code that interpret the signals sent by modules, sensors, and peripherals.
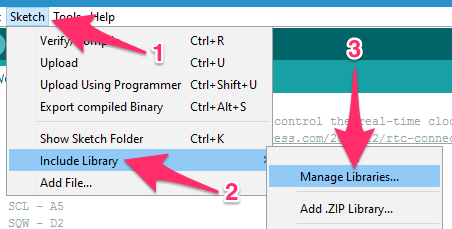
1Open the Arduino IDE. Go to Sketch → Include Library → Manage Libraries… A new window will open.
2Type the library names (listed in bold below) in the Filter your search… box. Click on the correct library and choose Install or Update. Scroll within the window if the library does not immediately appear. Click the white X in the upper-right corner when finished.
- RTClib by Adafruit Version 1.2.0 (or higher)
- OneWire by Jim Studt, et al. Version 2.3.3 (or higher)
- SD by Arduino, SparkFun Version 1.2.0 (or higher)
Wiring
A number of circuits are made using jumper wires, a breadboard, the Arduino, and the sensors/modules when building the RIFFLE.
Jumper Wire Background Information
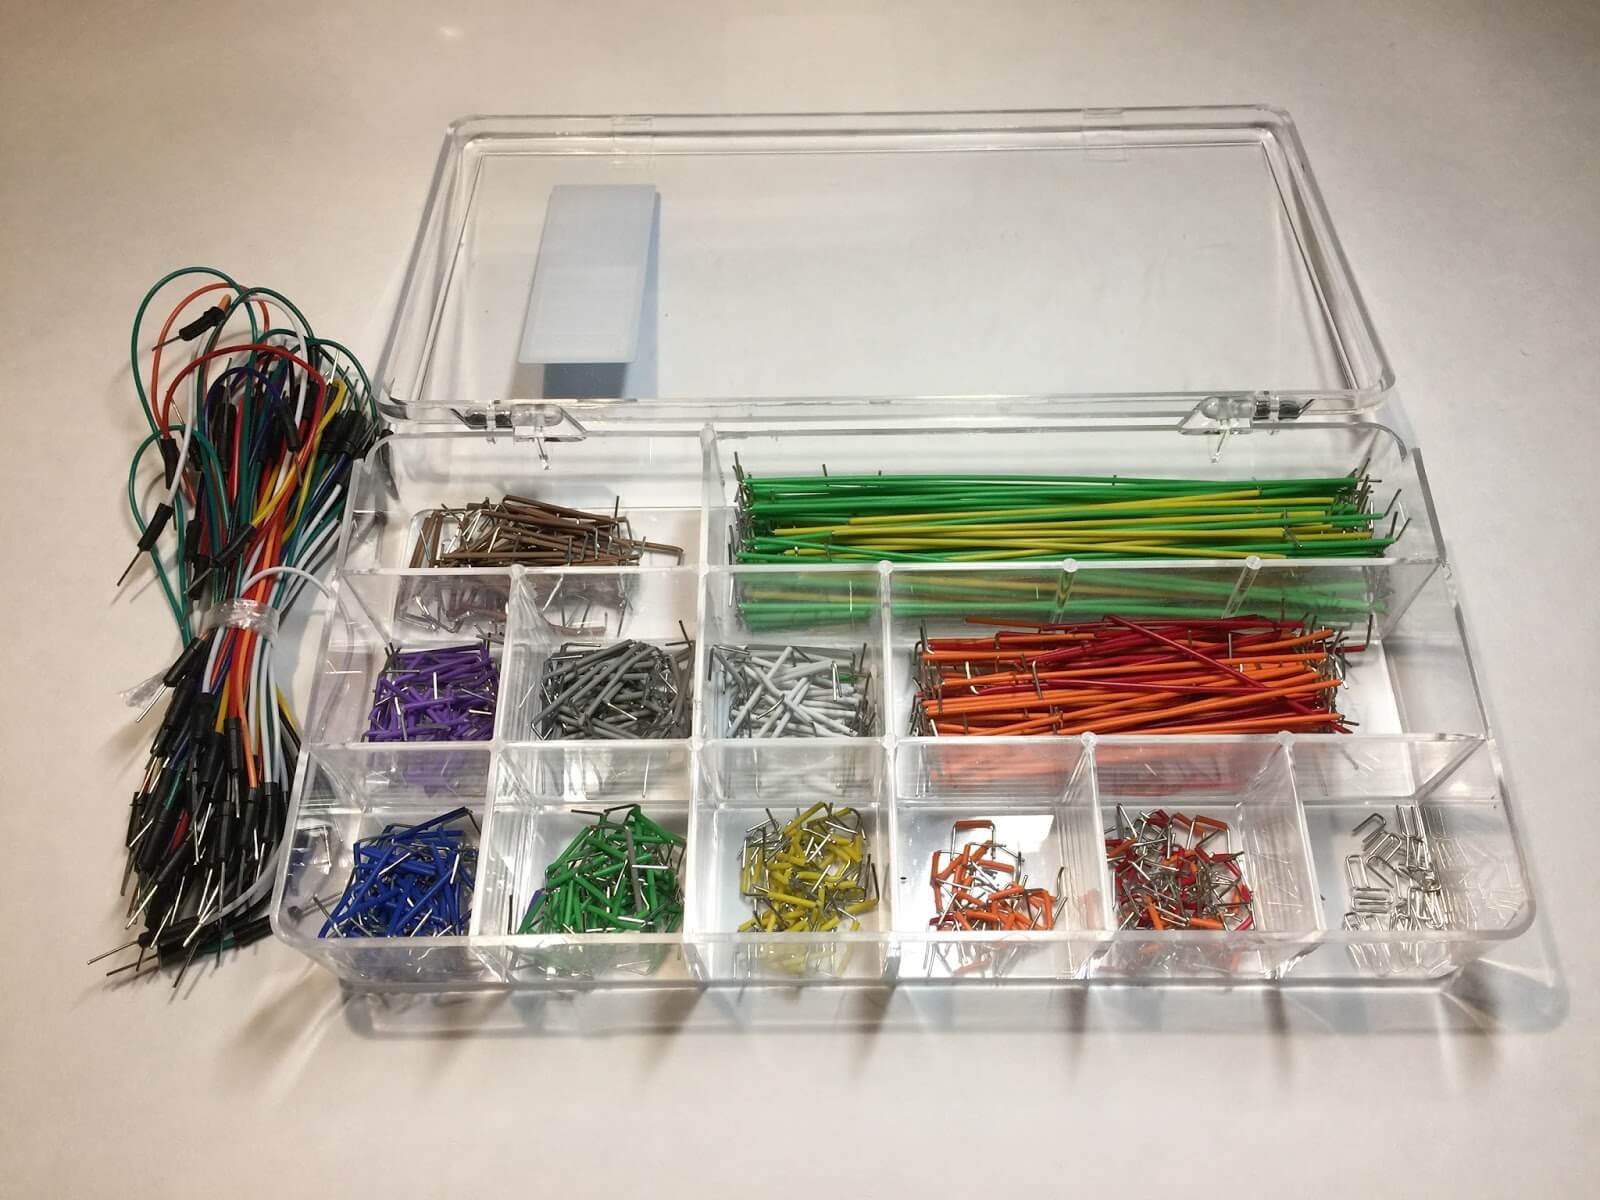
Jumper wires connect sensors and modules. Flat jumper wires look like a “C” or “U” depending on how you hold them, and regular jumper wires are long and flexible with black, plastic ends. In the image below, the flat jumper wires are in the clear case on the right and the regular jumper wires are on the left.
Regular jumper wires have different connection ends. If a solid metal piece sticks out of one end, then it’s a male connector. Conversely, no metal piece indicates a female connector. That means that there are three types of regular jumper wires: Male-Male (MM), Male-Female (MF), and Female-Female (FF). Choose the most appropriate type of regular jumper wire when building the RIFFLE.
The colored plastic wrapping that covers the metal in a jumper wire is an insulator. The color of each wire does not necessarily matter apart from making it easier to isolate connections. Red is typically used when connecting power (aka, VCC) pins in a circuit, and black often indicates ground (aka, GND) connections.
Breadboard Background Information
A breadboard is a prototyping platform for building electronics. The breadboard is the location where sensors, modules, and the Arduino are connected together to form circuits.
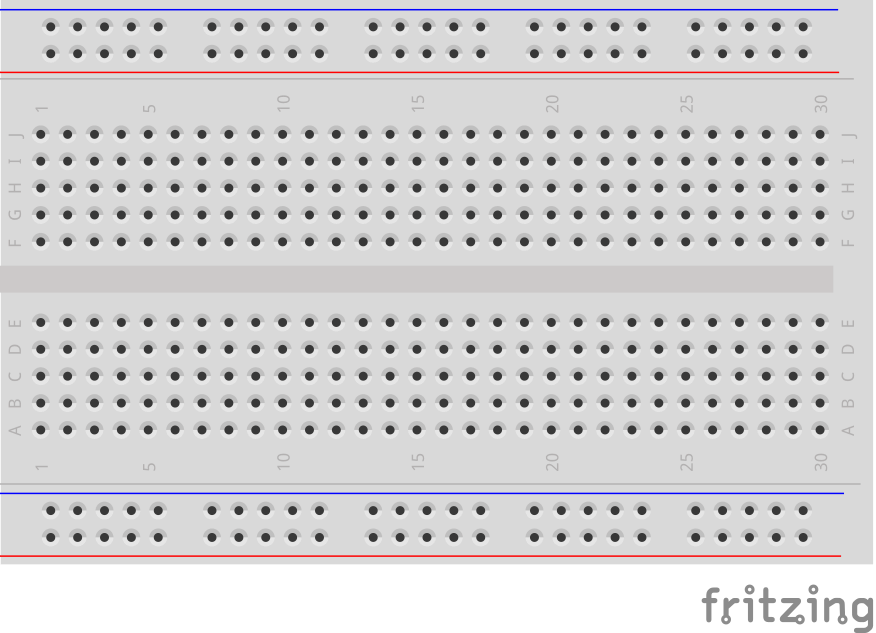
There is a grid of tiny holes on the top and a sticky bottom for mounting the breadboard (400 Tie-In Breadboard = 400 holes). Some breadboards have letters and numbers to identify specific holes in the grid. The numbers span the long side and the letters run the length of the short side. It’s possible to figure out an exact hole by reading the breadboard like a map.
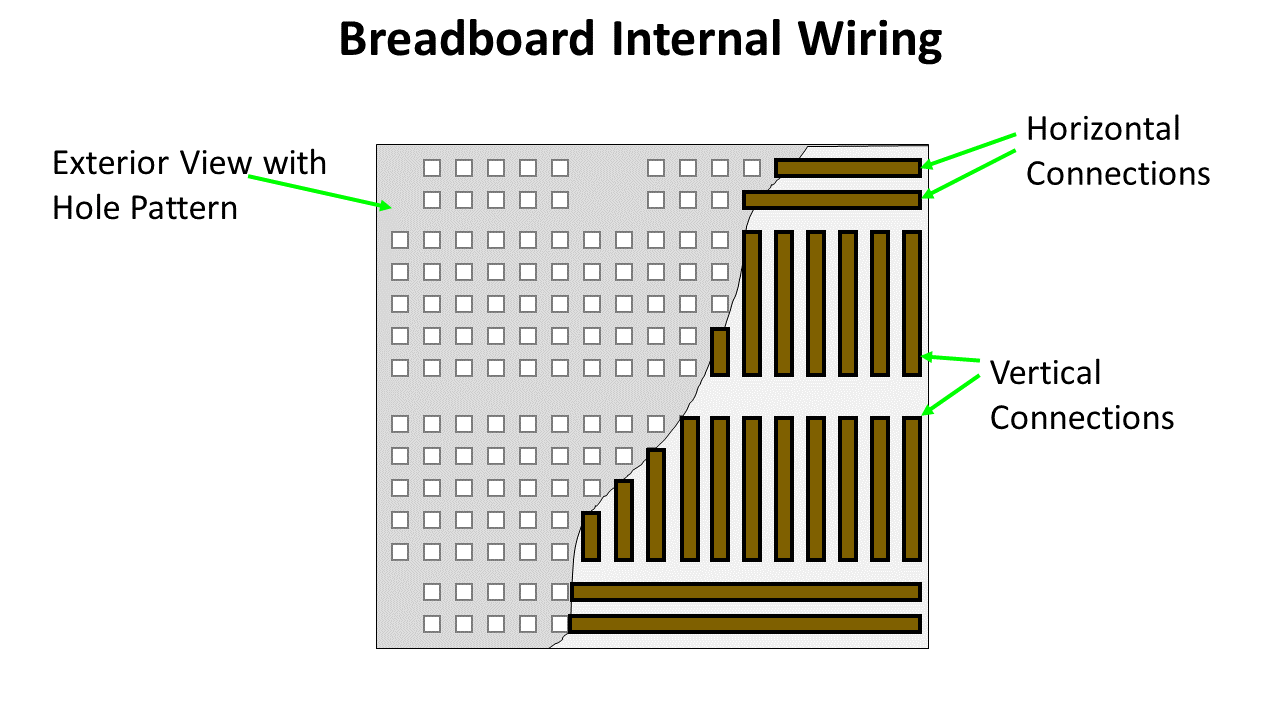
The holes are the exact size to secure one end of a jumper wire. When a jumper wire is placed in a hole on the breadboard, it makes contact with a thin strip of metal beneath the plastic top. The diagram below shows both the horizontal and vertical metal connections hidden behind the holes.
Two long lines of holes surrounded by a blue (- or ground) and red line (+ or power) designate the power rails. Power rails are used to provide power/ground to any connected sensors or modules.
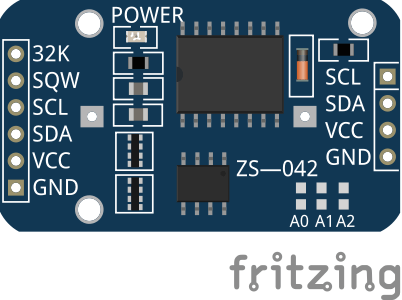
RTC: Real-Time Clock
RTC stands for real-time clock. The RTC is a module that’s important in the RIFFLE; it adds a timestamp that shows the date and time when a sensor reading occurs. Without the RTC, all of the data would be one gigantic mess of numbers!
RTC Wiring
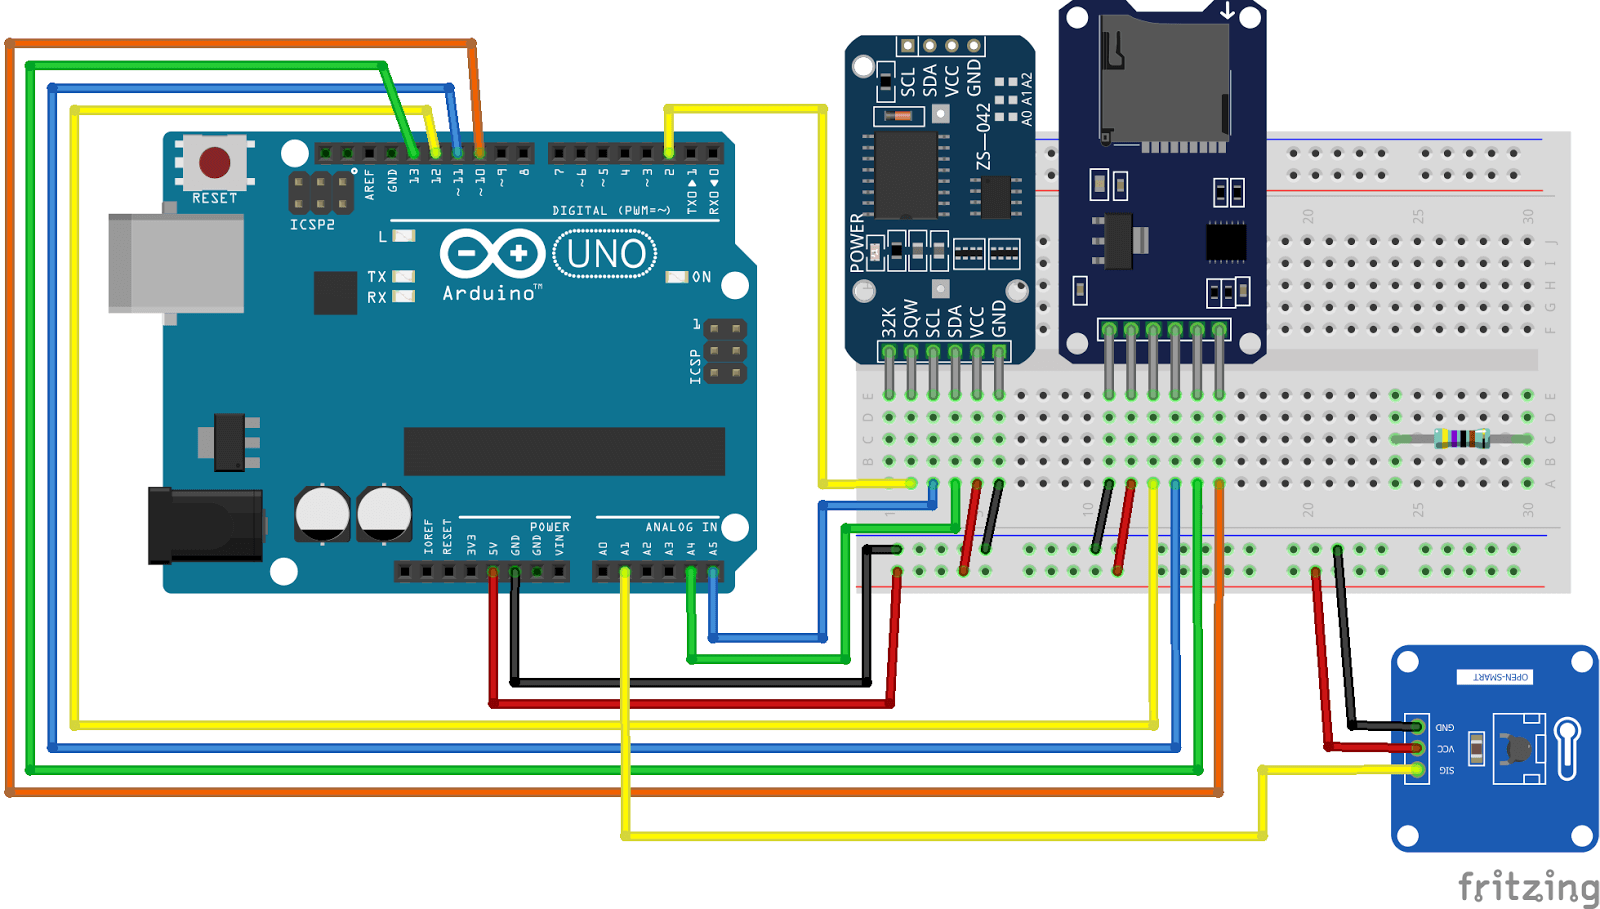
- Jumper wire colors are helpful indicators of different connections in the RIFFLE. However, the color is part of an insulating wrapper around a piece of metal, so any jumper wire will work in the circuits below.
- Click any of the diagrams to enlarge the picture and zoom in.
1Make sure the watch battery is securely in place on the back of the RTC. The lettering on the battery should be facing away from the RTC.
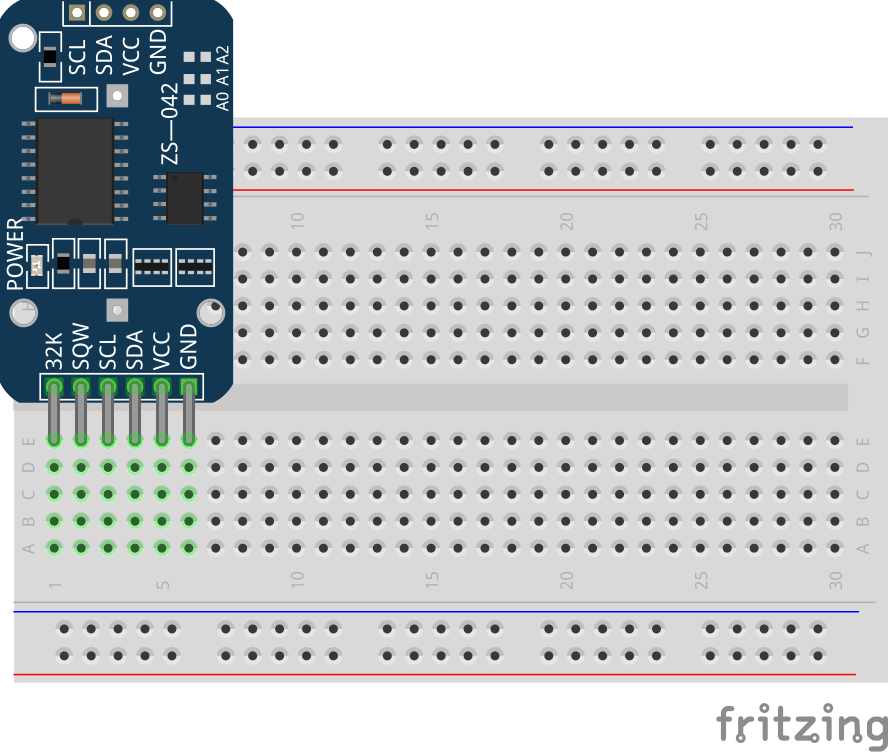
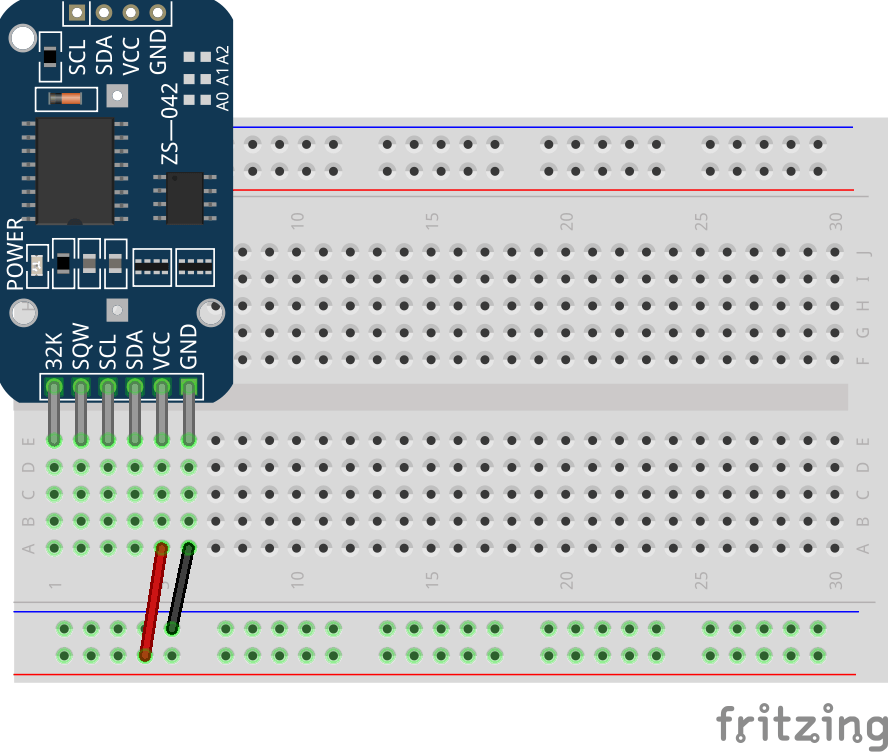
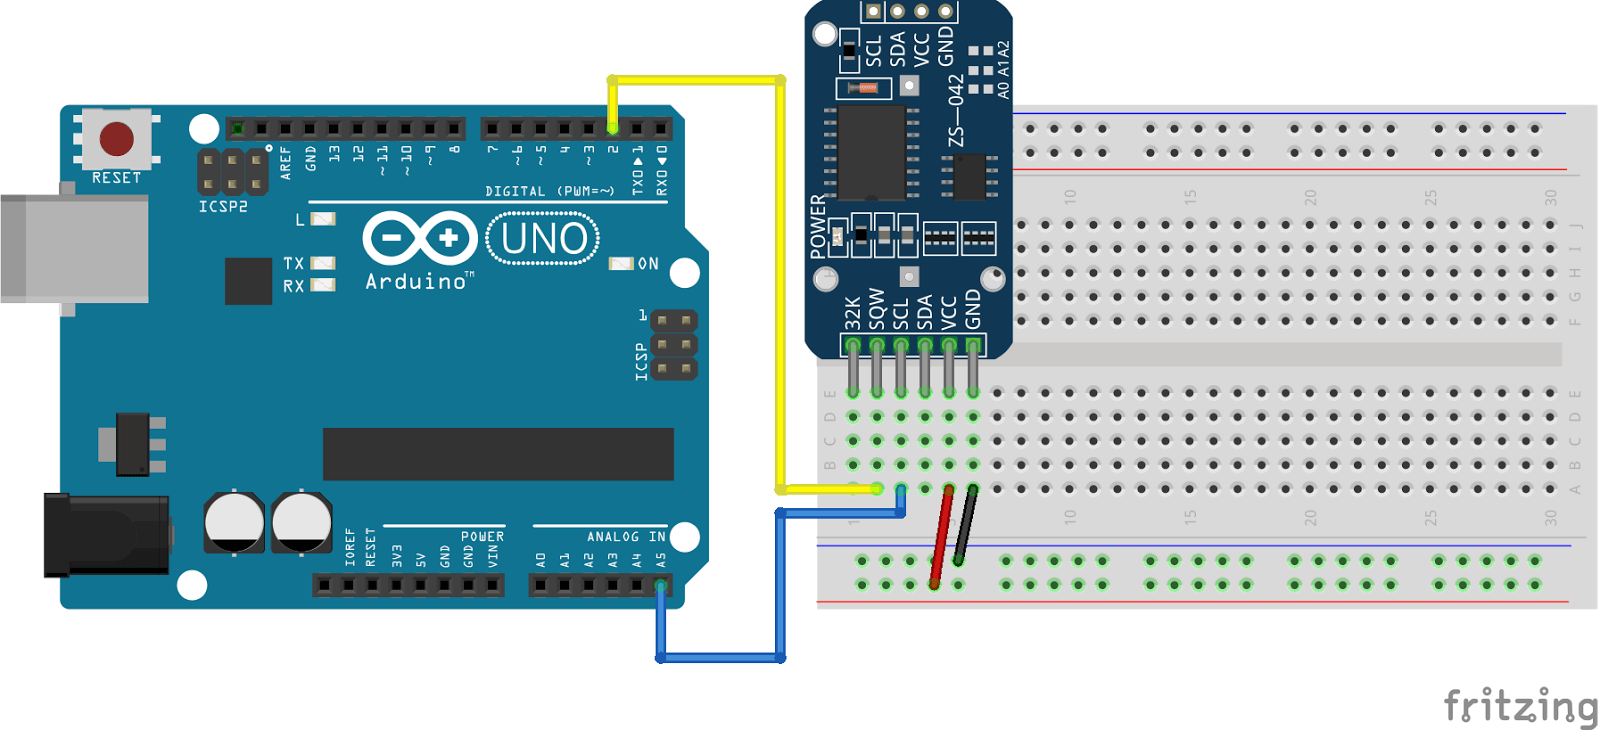
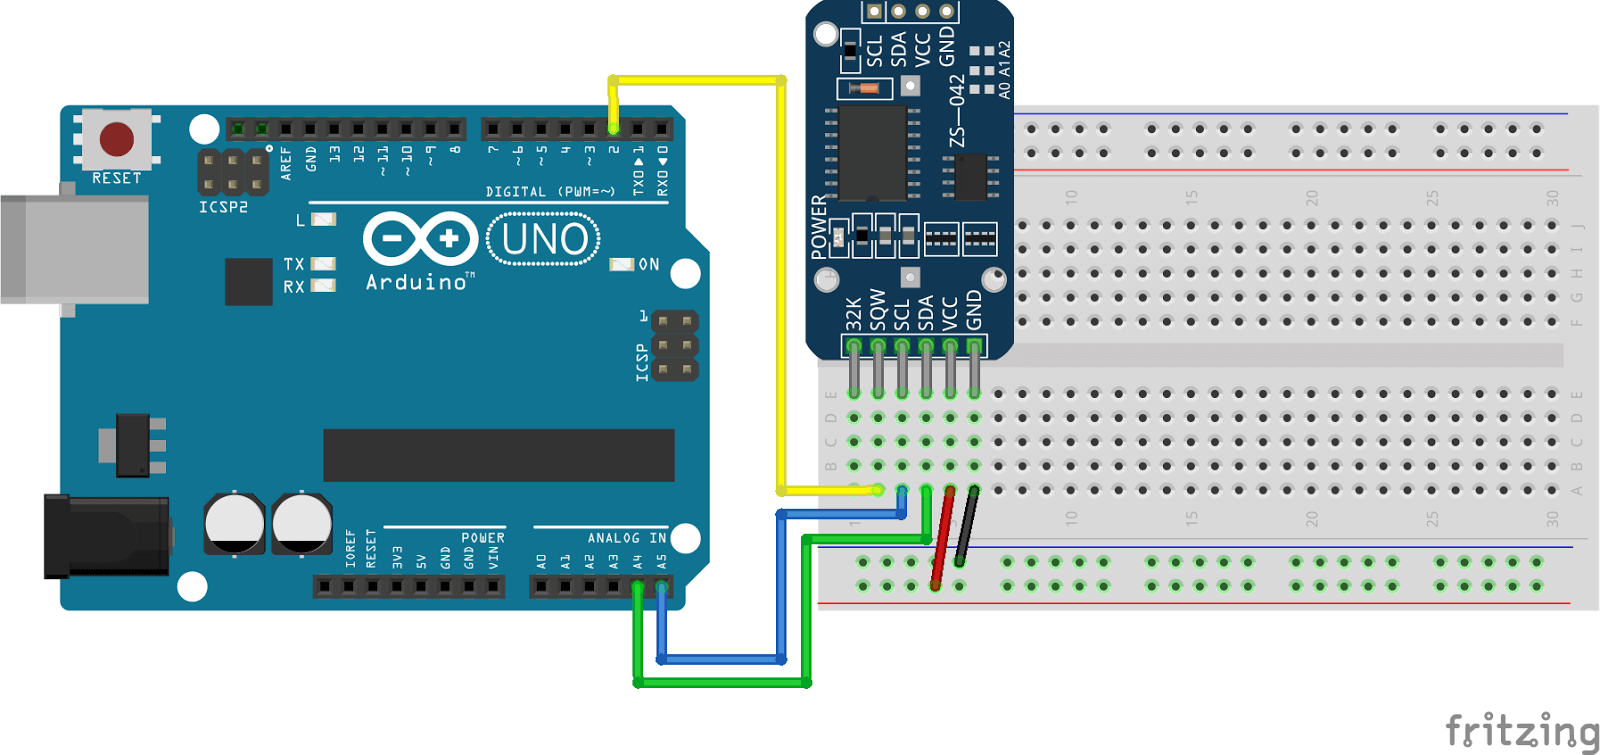
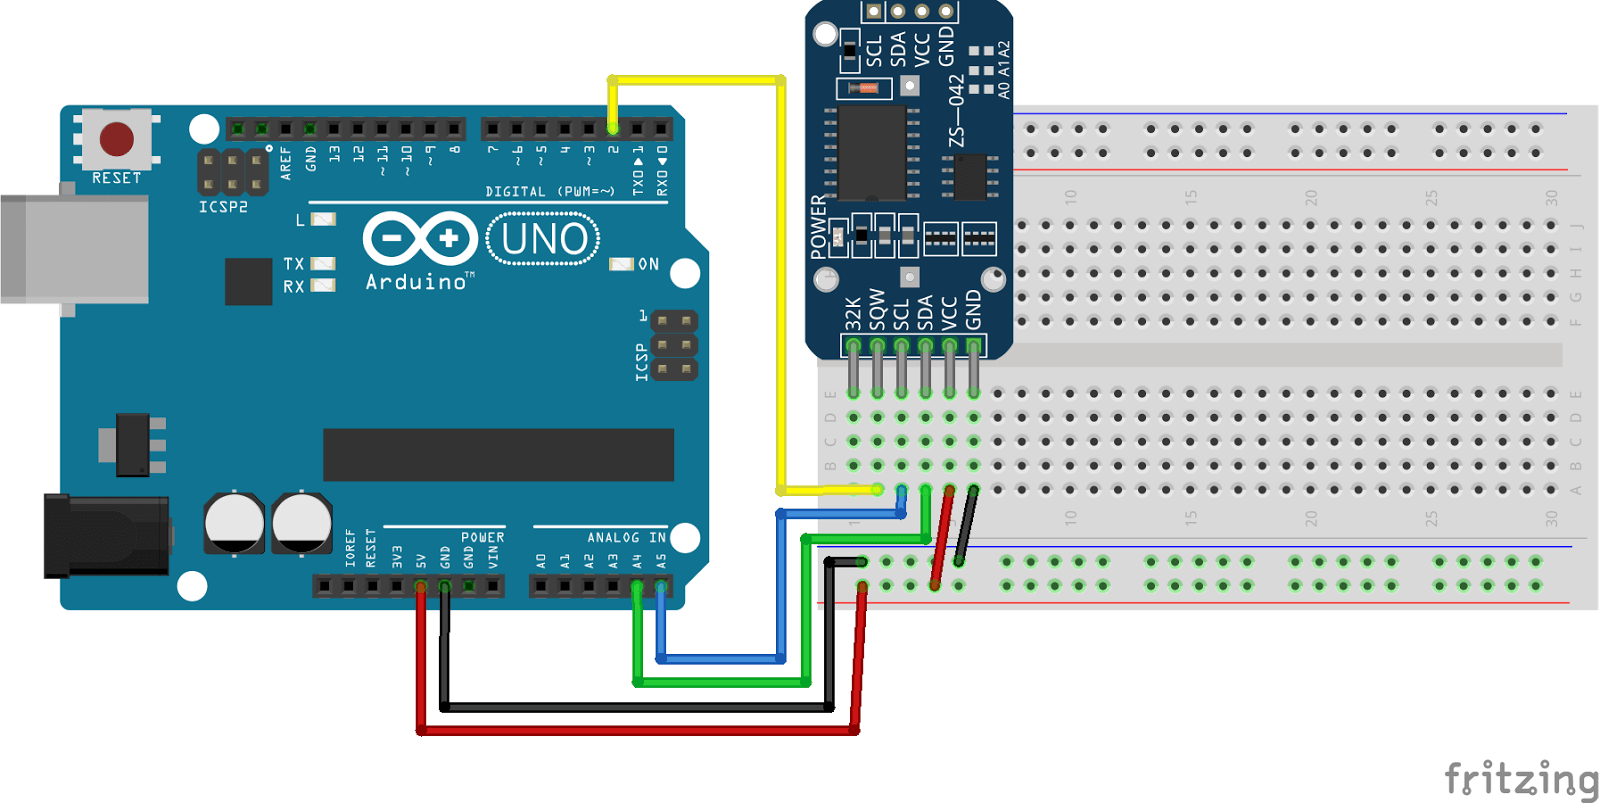
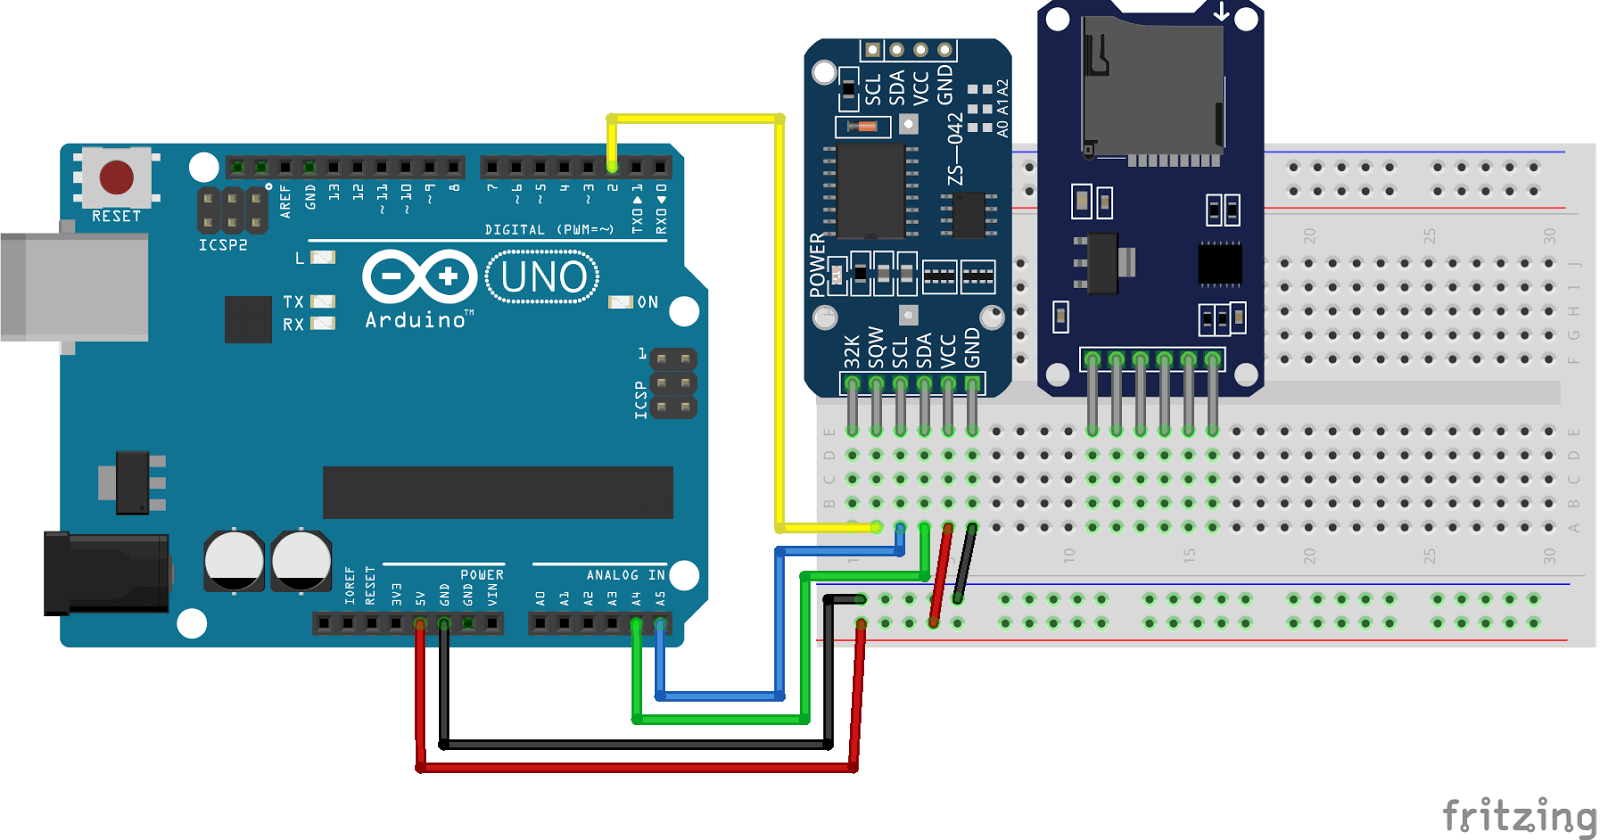
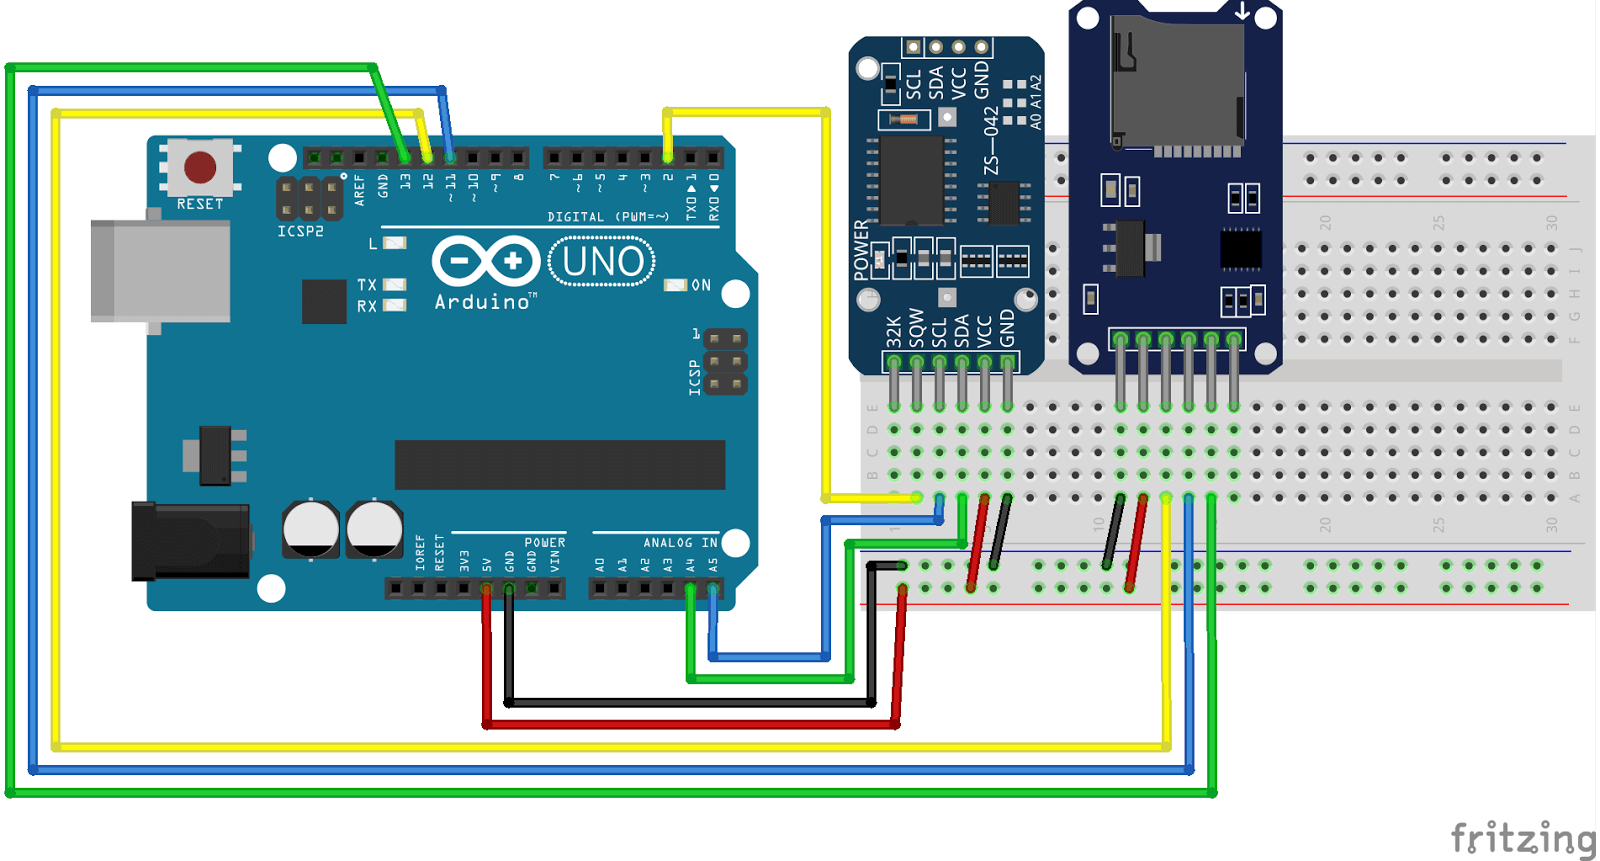
2Insert the RTC into the breadboard. Place the 32K pin in E-1 on the breadboard. GND should be in E-6 on the breadboard if the RTC is inserted correctly.
3Connect the VCC pin by placing a flat jumper wire from A-5 to any hole on the “+” power rail on the breadboard. Connect the GND pin by placing a flat jumper wire from A-6 to any hole on the “-” power rail on the breadboard.
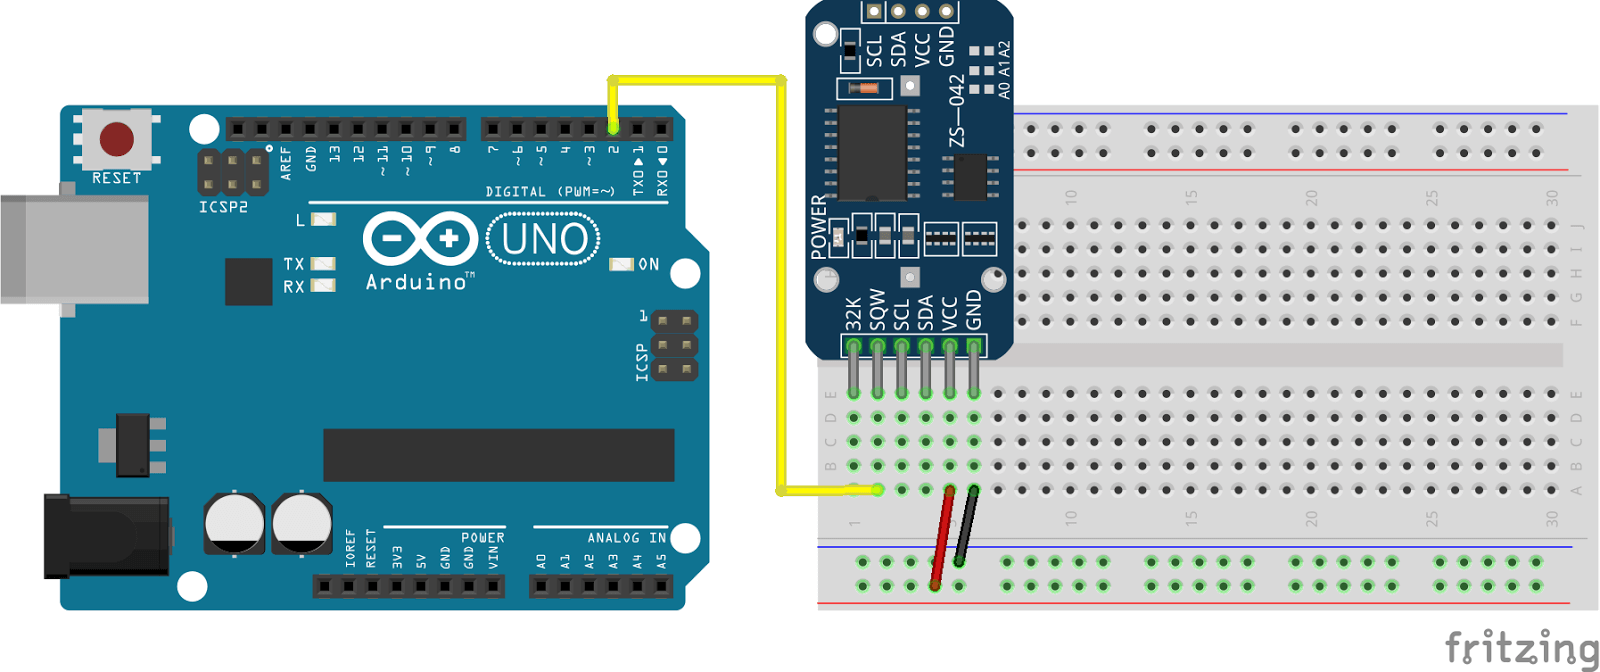
4Connect the SQW pin by pacing a jumper wire from A-2 on the breadboard to D2 on the Arduino.
5Connect the SCL pin by placing a jumper wire from A-3 on the breadboard to A5 on the Arduino.
6Connect the SDA pin by placing a jumper wire from A-4 on the breadboard to A4 on the Arduino.
7Connect the “-” power rail on the breadboard to the GND pin on the Arduino. Connect the “+” power rail on the breadboard to the 5V pin on the Arduino.
Setting the Time on the RTC
The time on the RTC must be set in order for the RIFFLE to work properly. Once set, the RTC will keep accurate time until the watch battery is dislodged or completely drained of power. The RTC’s time must be reset for daylight savings time or when the battery is removed.
1Connect the Arduino to the computer with the USB cord. The RTC should be properly wired to the breadboard and Arduino. See the previous section of this tutorial for instructions on how to wire the RTC.
2Download the RTC_Setup.ino file and save it to a location on your computer.
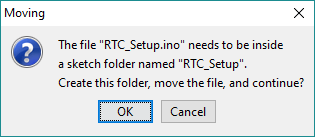
3Double-click and open the RTC_Setup.ino file. If prompted, click OK to create a sketch folder, move the file, and continue.
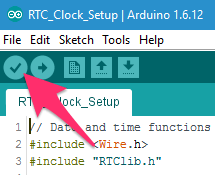
4Verify that the compiled code is error free by clicking the check mark button in the Arduino IDE.
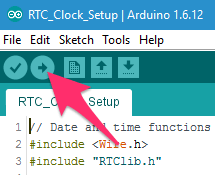
5Upload the code to the Arduino by clicking the arrow button in the Arduino IDE. Wait for the sketch to compile and upload successfully before going to Step 6.
6Open the serial monitor by clicking the magnifying glass button in the upper right corner of the Arduino IDE.
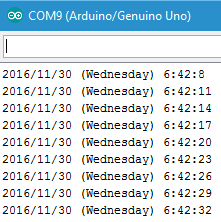
7Check the data stream in the serial monitor window to confirm that the correct date/time appears. It should look similar to the picture below.
8The date and time is set on the RTC. It will continue to be accurate until the watch battery is dislodged or empty. Close the Arduino IDE and disconnect the USB cord from the computer.
Micro-SD Card Module (Datalogger)
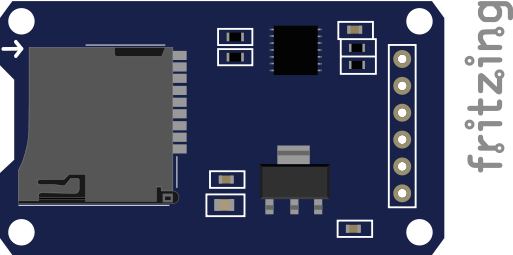
The Micro-SD Card Module contains a slot for a Micro-SD Card. A Micro-SD Card is a storage device often used for saving files or data; many phones use Micro-SD Cards for this purpose. The Micro-SD Card and Micro-SD Card Module work together as a single unit to save any readings when the RIFFLE is placed in the field. In this respect, both act as a datalogger for the connected sensors. They are the logging part of Remote Independent Field Friendly Logging Electronic.
Note
It’s best to wire the Micro-SD Card when there’s no power to the board. Unplug the Arduino from the computer and/or any power source.
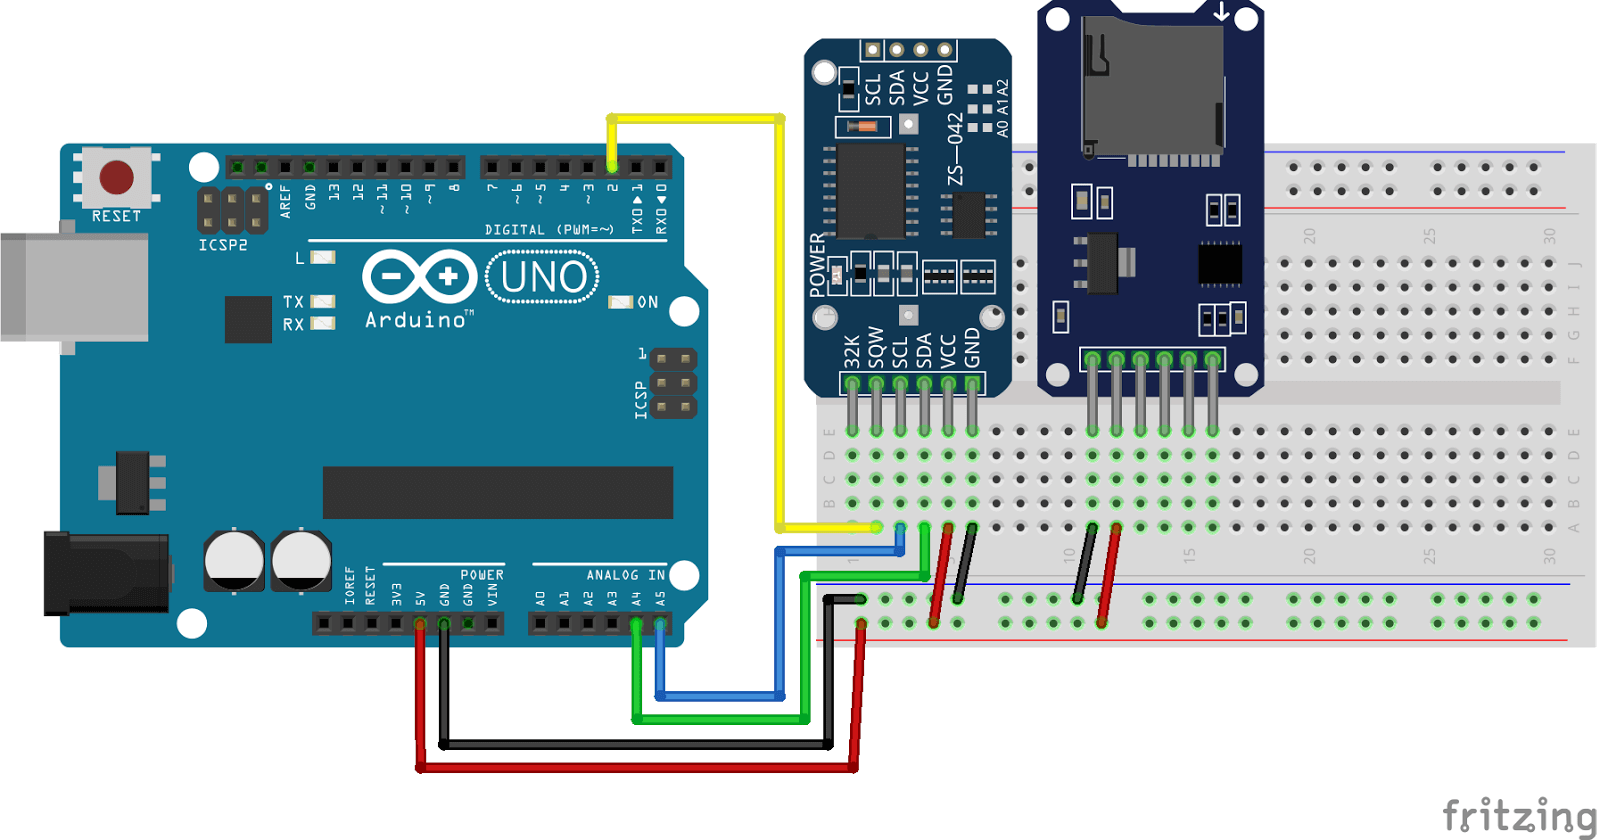
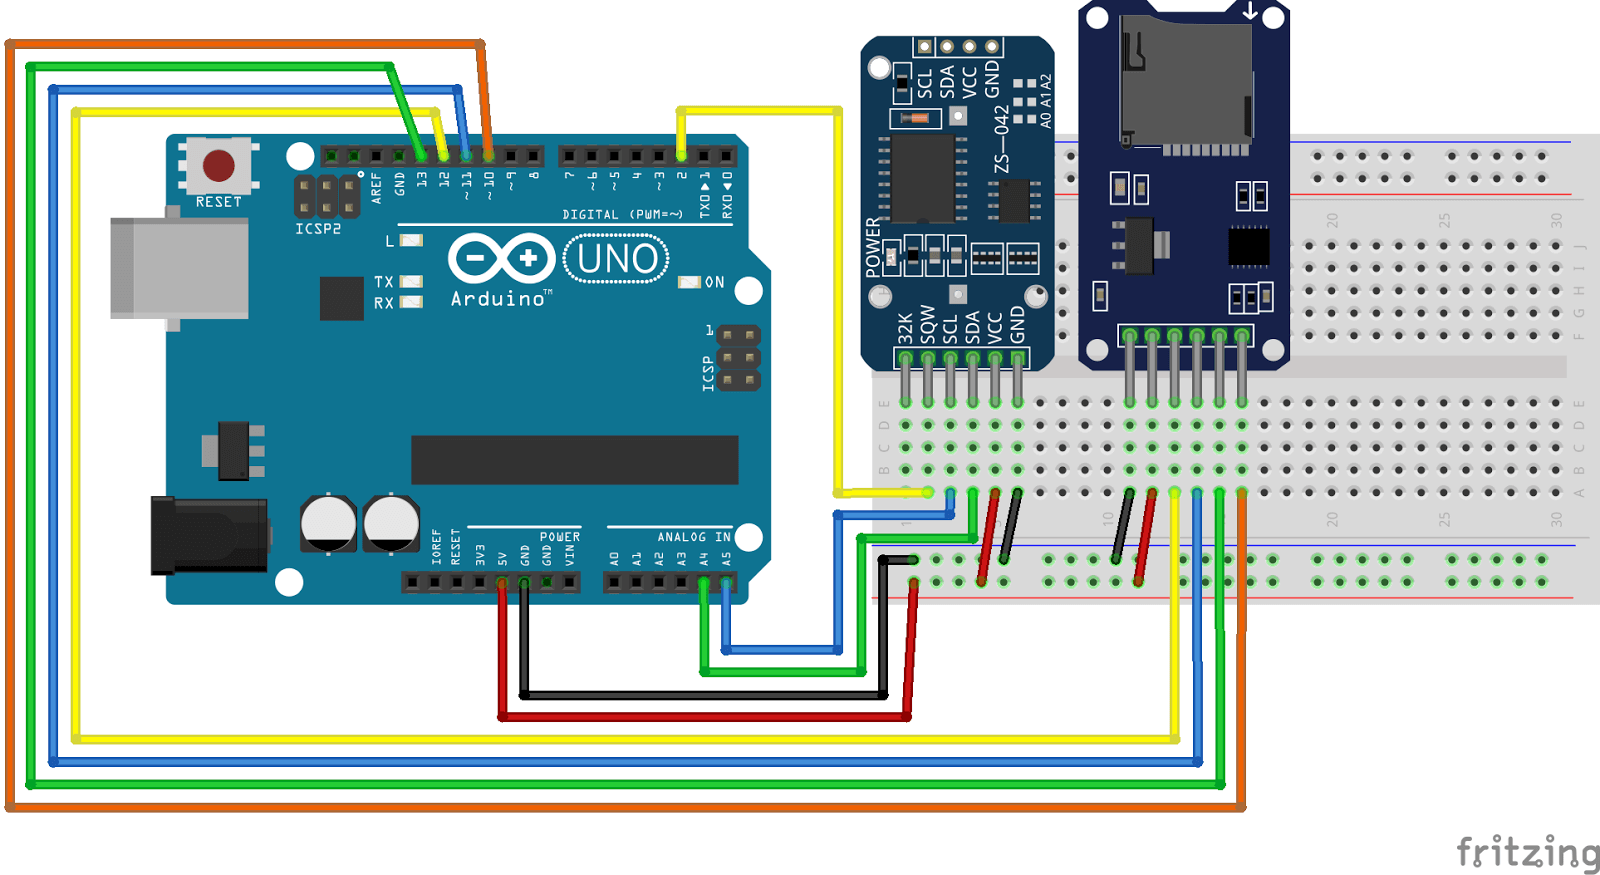
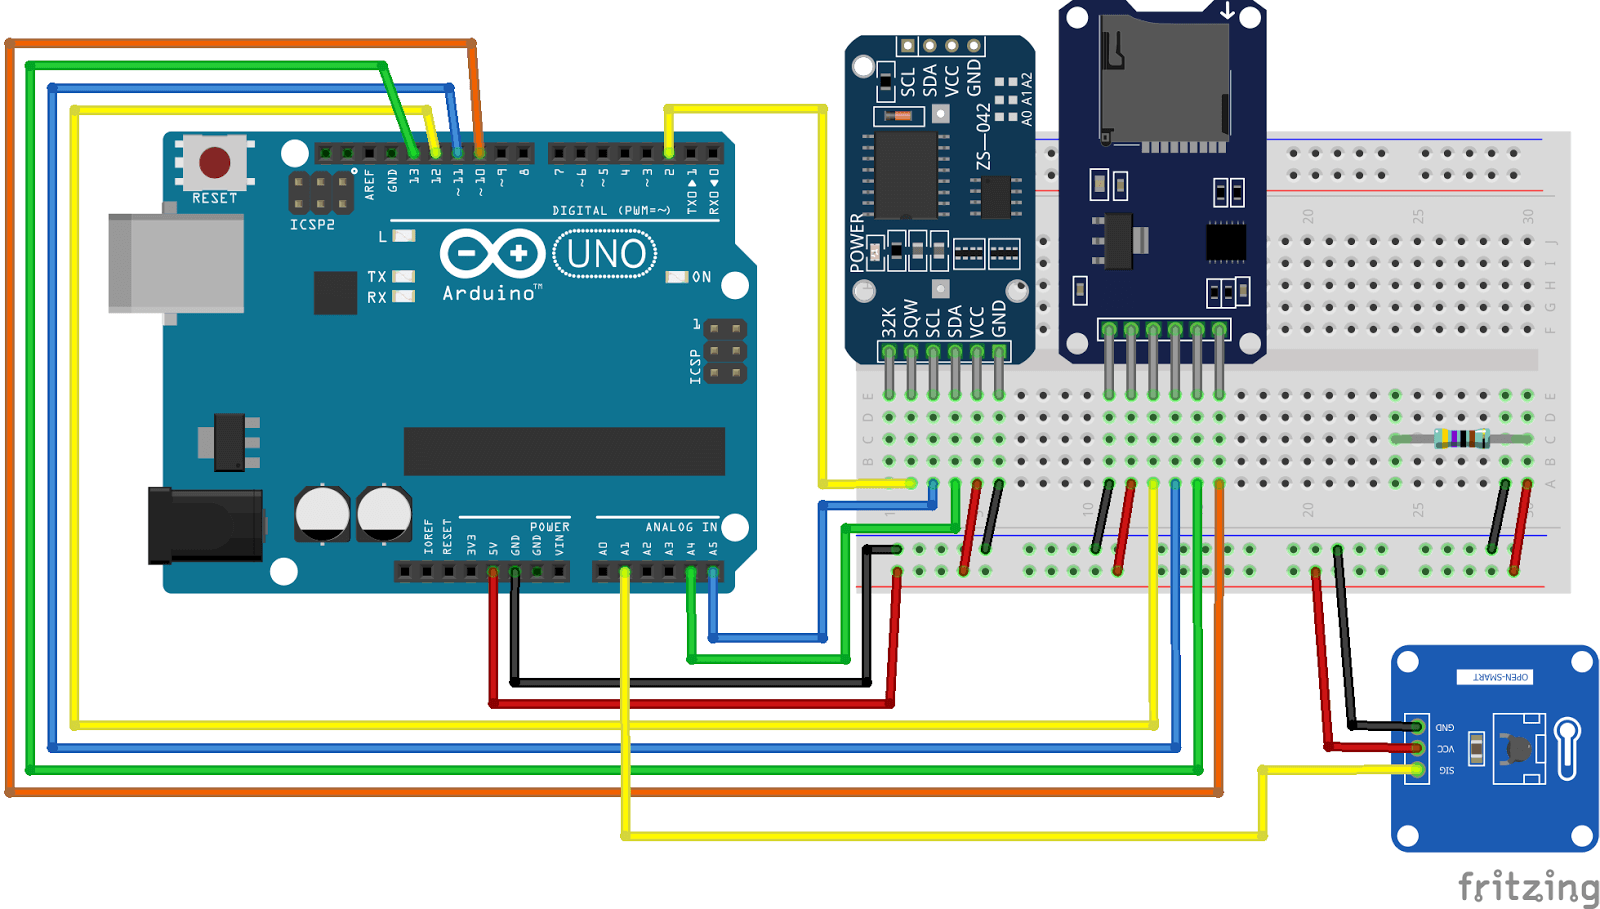
1Insert the Micro-SD Card Module into the breadboard. Place the GND pin in E-11 on the breadboard. CS should be in E-16 on the breadboard if the Micro-SD Card Module is inserted correctly.
2Connect the GND pin by pacing a flat jumper wire from A-11 to the “-” power rail on the breadboard. Connect the VCC pin by pacing a flat jumper wire from A-12 to the “+” power rail on the breadboard.
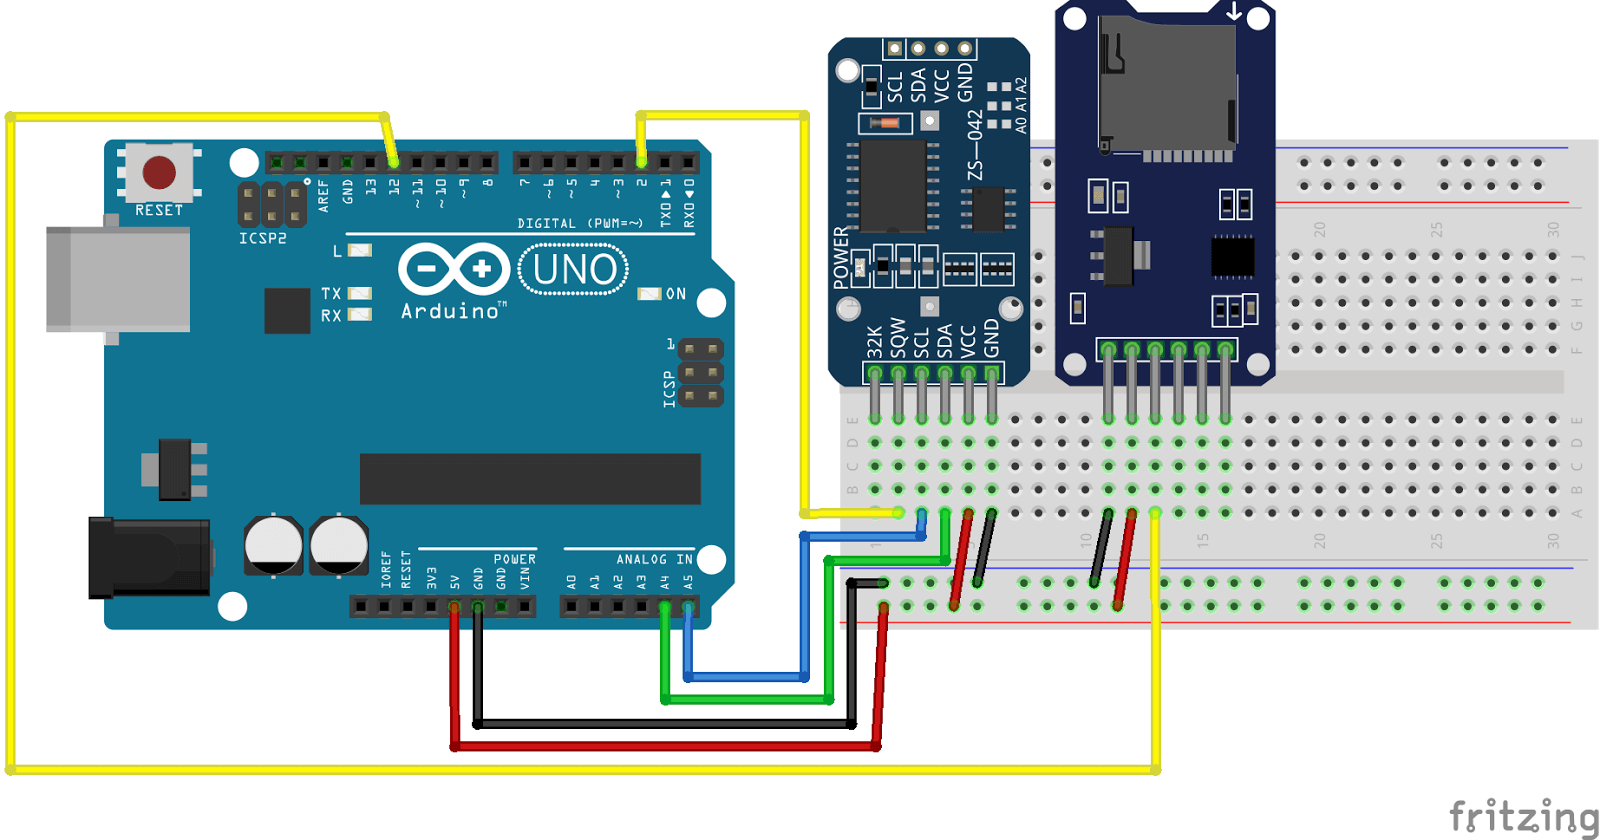
3Connect the MISO pin by pacing a jumper wire from A-13 on the breadboard to D12 on the Arduino.
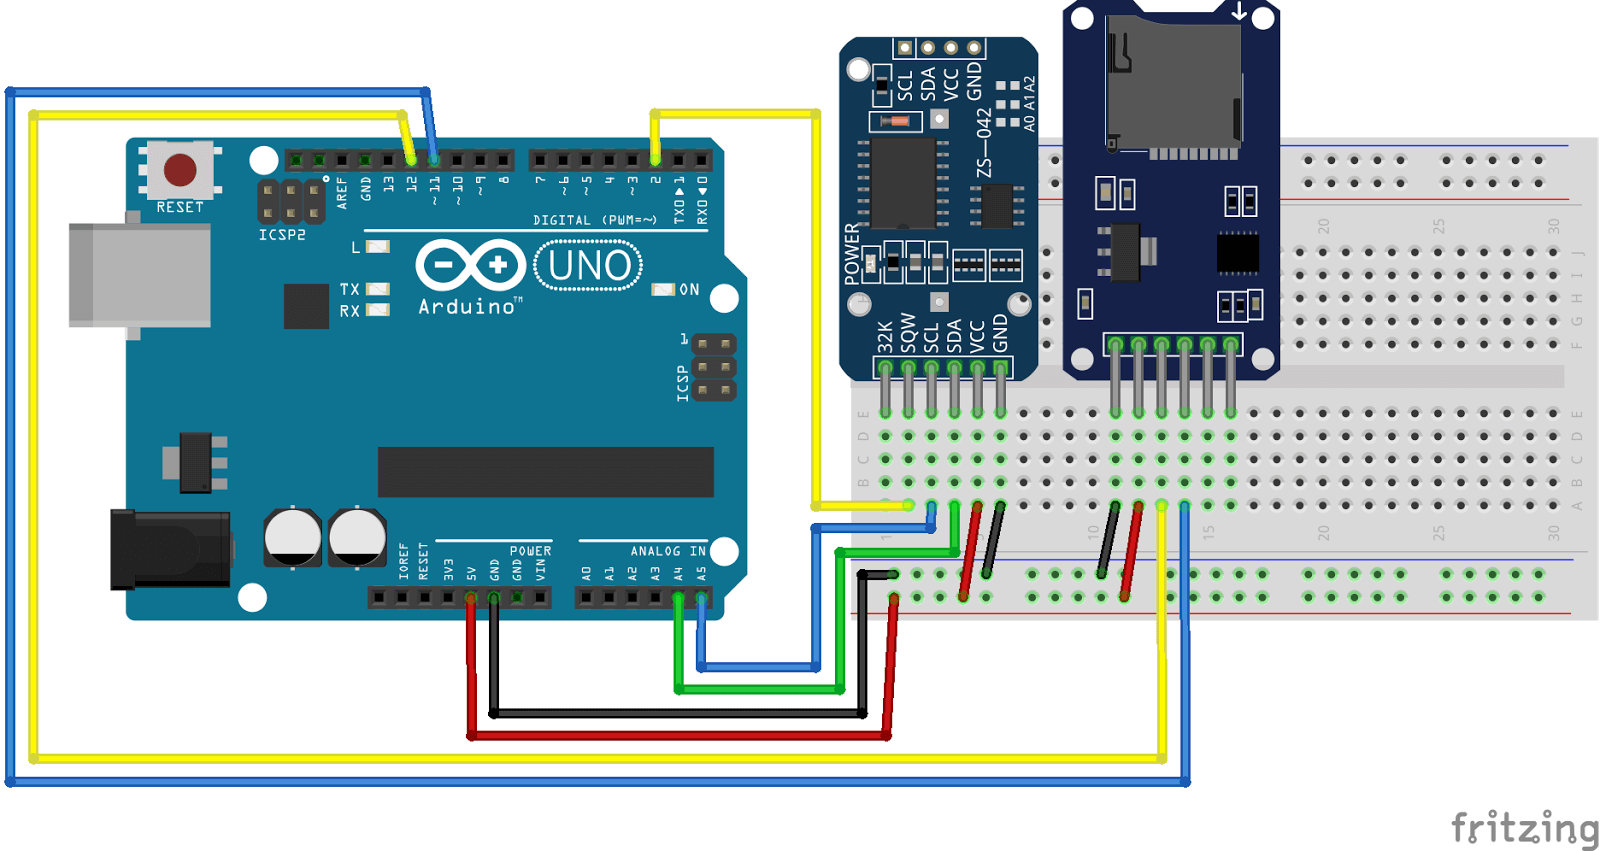
4Connect the MOSI pin by pacing a jumper wire from A-14 on the breadboard to D11 on the Arduino.
5Connect the SCK pin by pacing a jumper wire from A-15 on the breadboard to D13 on the Arduino.
6Connect the CS pin by pacing a jumper wire from A-16 on the breadboard to D10 on the Arduino.
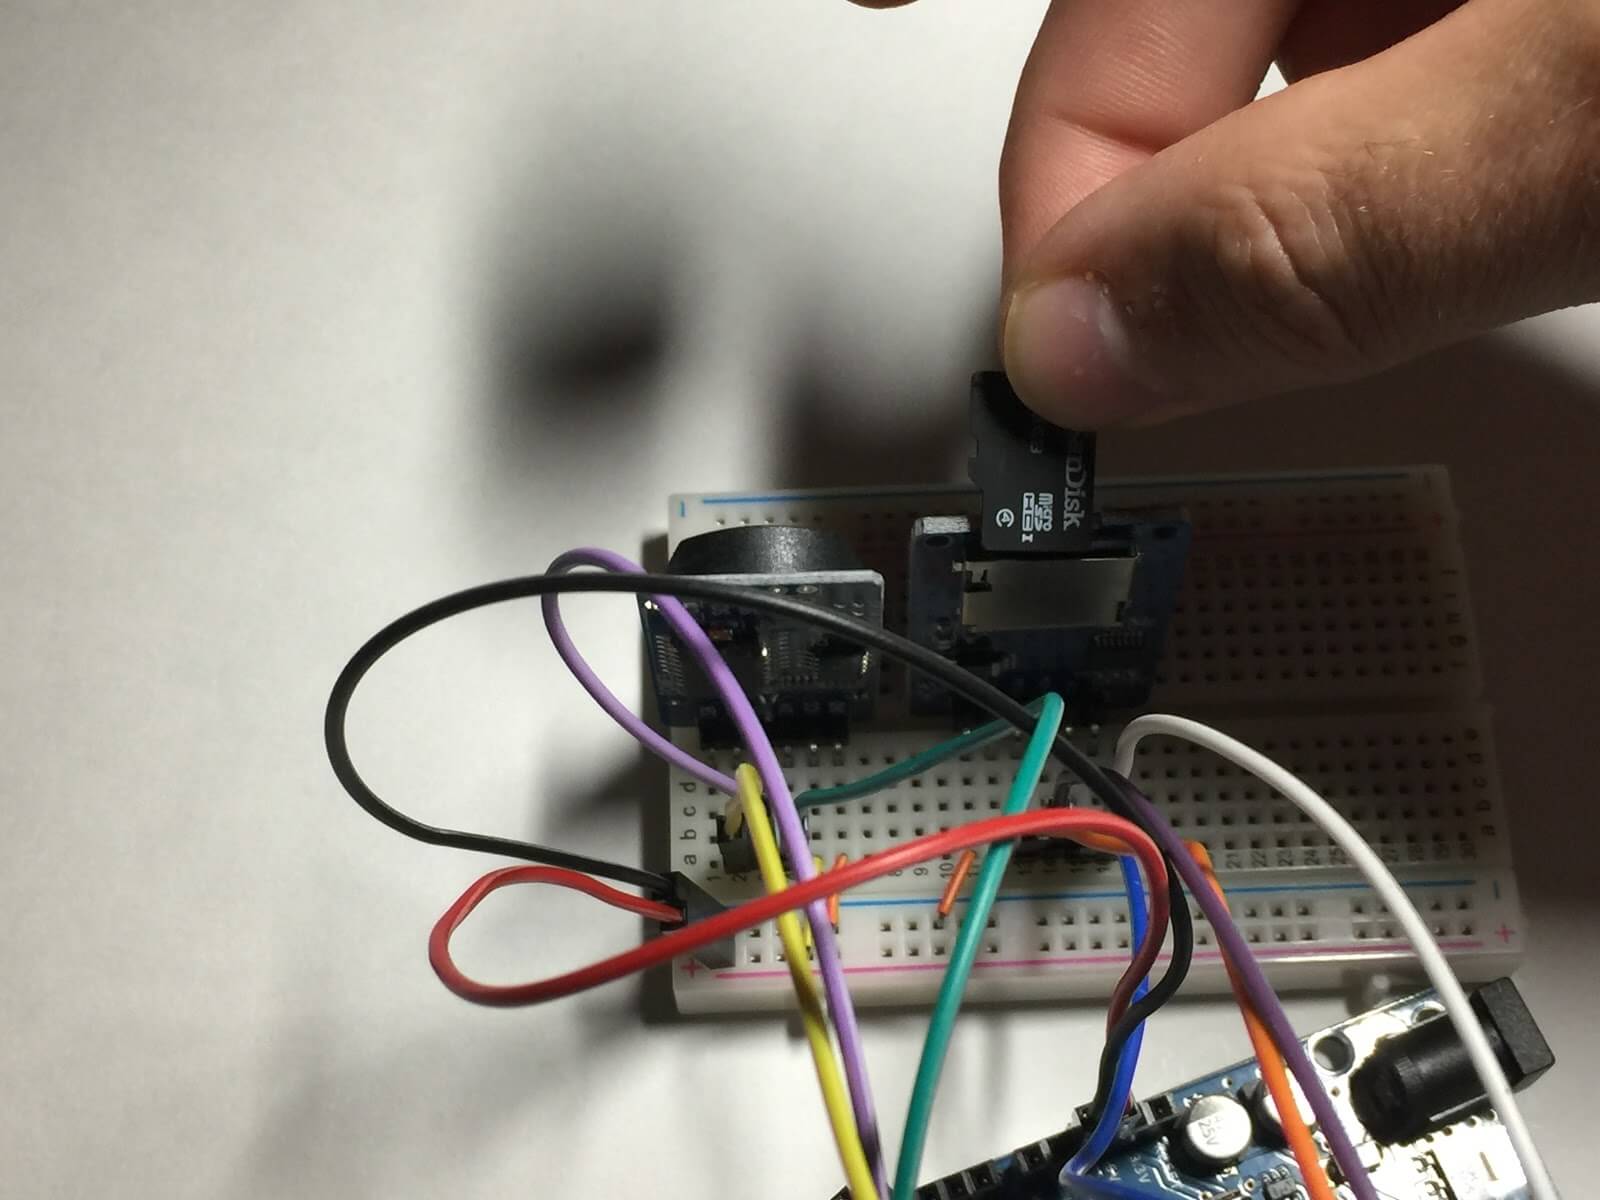
7Insert the Micro-SD Card into the module. The writing on the card should face away from the module, and it should click in place.
OPEN-SMART Thermistor
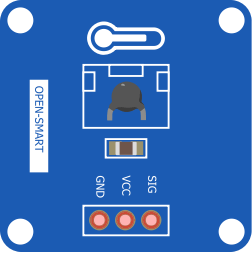
A thermistor is a type of electrical resistor that measures temperature. When properly wired, the OPEN-SMART Thermistor’s electrical resistance decreases when the temperature increases. That makes it a good temperature sensor for measuring the ambient conditions in an environment.
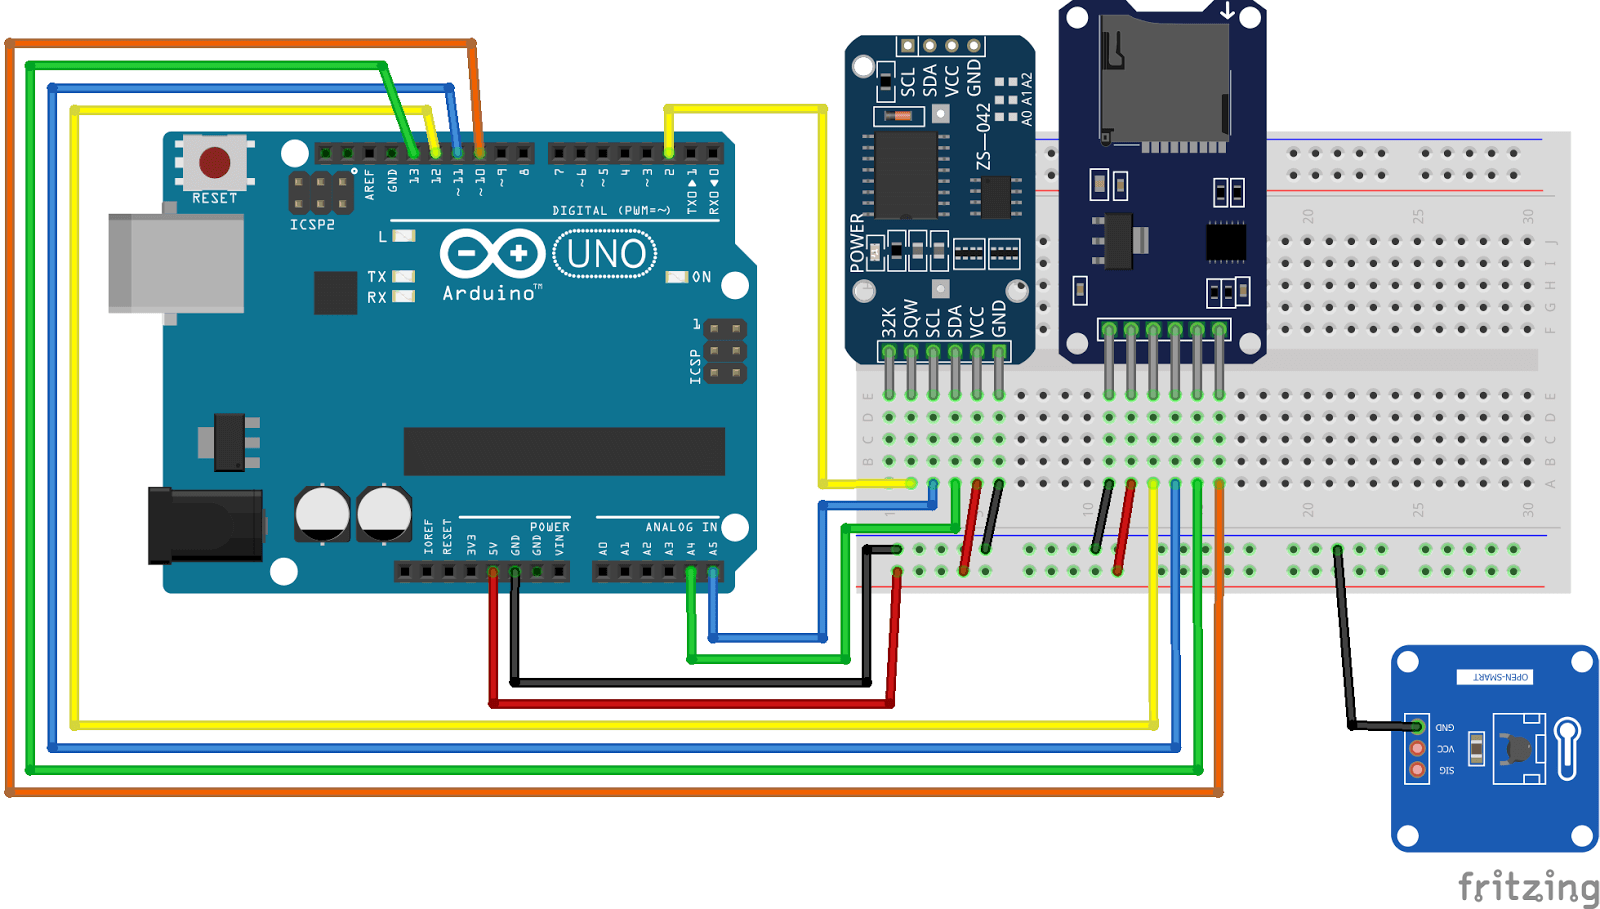
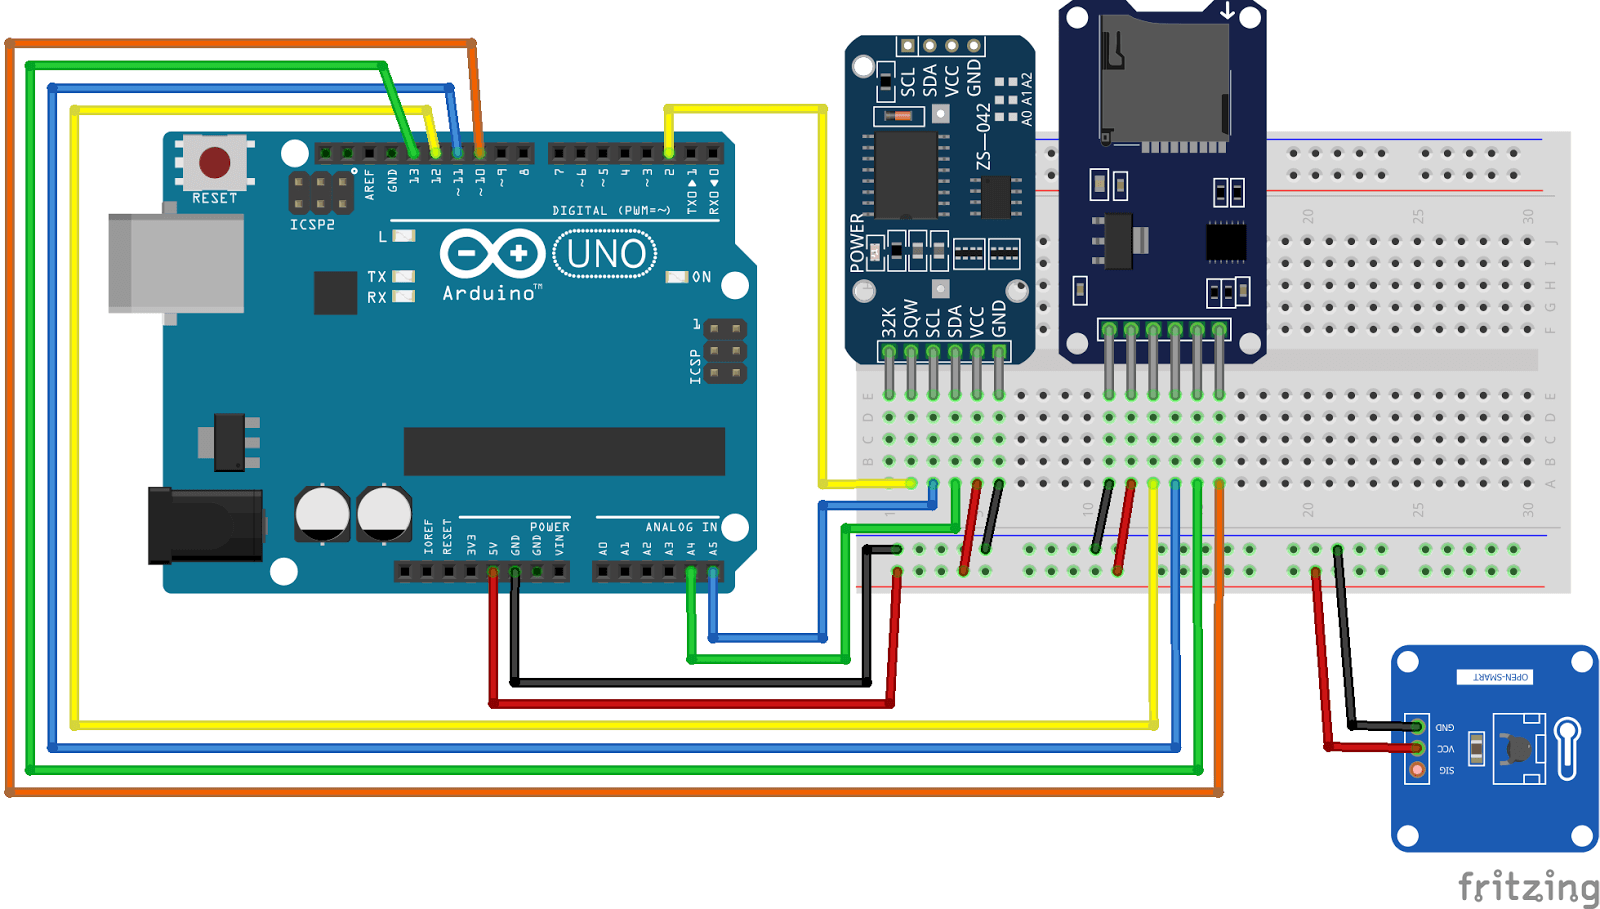
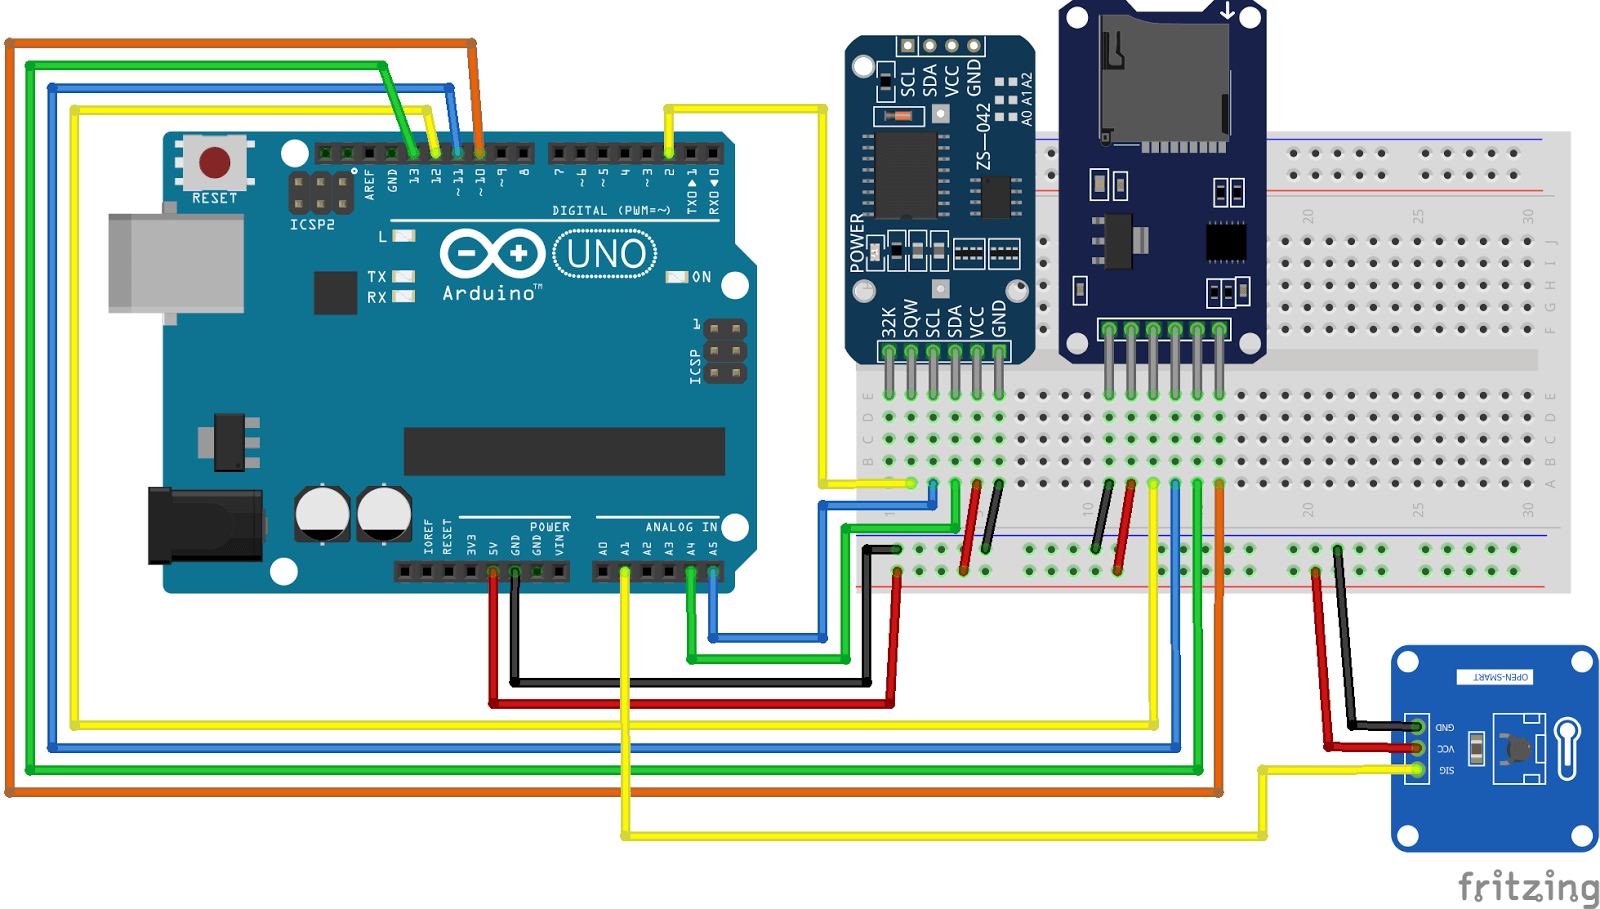
1Connect a MF jumper wire to the GND pin on the thermistor. Black is the most common indicator of a ground (GND) connection.
2Connect a MF jumper wire to the VCC pin on the thermistor. Red is the most common indicator of a power (VCC or VIN) connection.
3Connect a MF jumper wire to the SIG pin on the thermistor. Pick a jumper wire color other than red, black, or the GND/VCC colors.
4Unplug the USB cord from the computer and remove any power sources that are connected to the Arduino. Without power, connect the GND jumper wire to the “-” power rail on the breadboard.
5Connect the VCC jumper wire to the “+” power rail on the breadboard.
6Connect the SIG wire to the A1 pin on the Arduino. The breadboard is not required for this connection.
Waterproof Thermometer
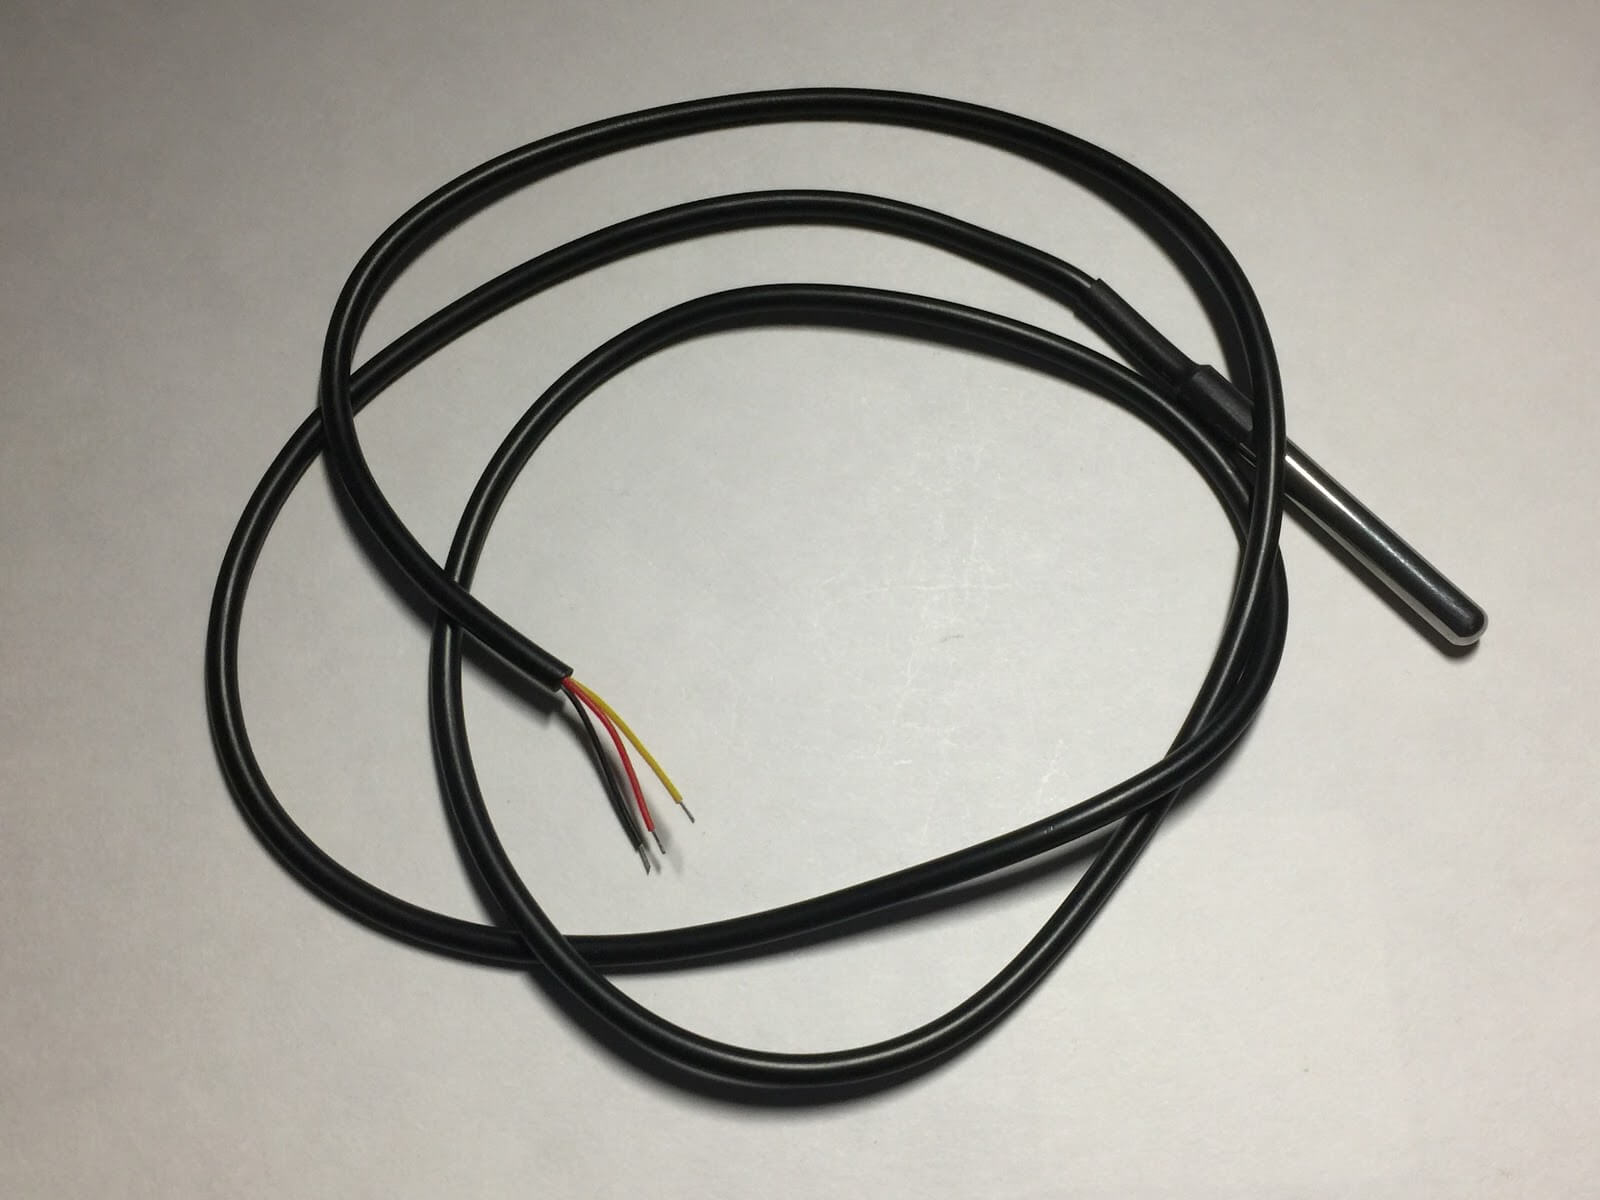
The waterproof thermometer measures changes in temperature in liquids and other areas not appropriate for a traditional thermistor. The waterproof thermometer in the RIFFLE is used to measure the temperature of the stream, creek, river, or lake that’s being tested.
Note
The waterproof thermometer requires modification before being used in the steps that follow. This includes soldering regular jumper wires to the red, black, and yellow wires. The soldered connections also need to be wrapped in electrical tape or shrink wrap to prevent short circuiting the sensor. Instructions on how to modify the waterproof thermometer are not listed below.
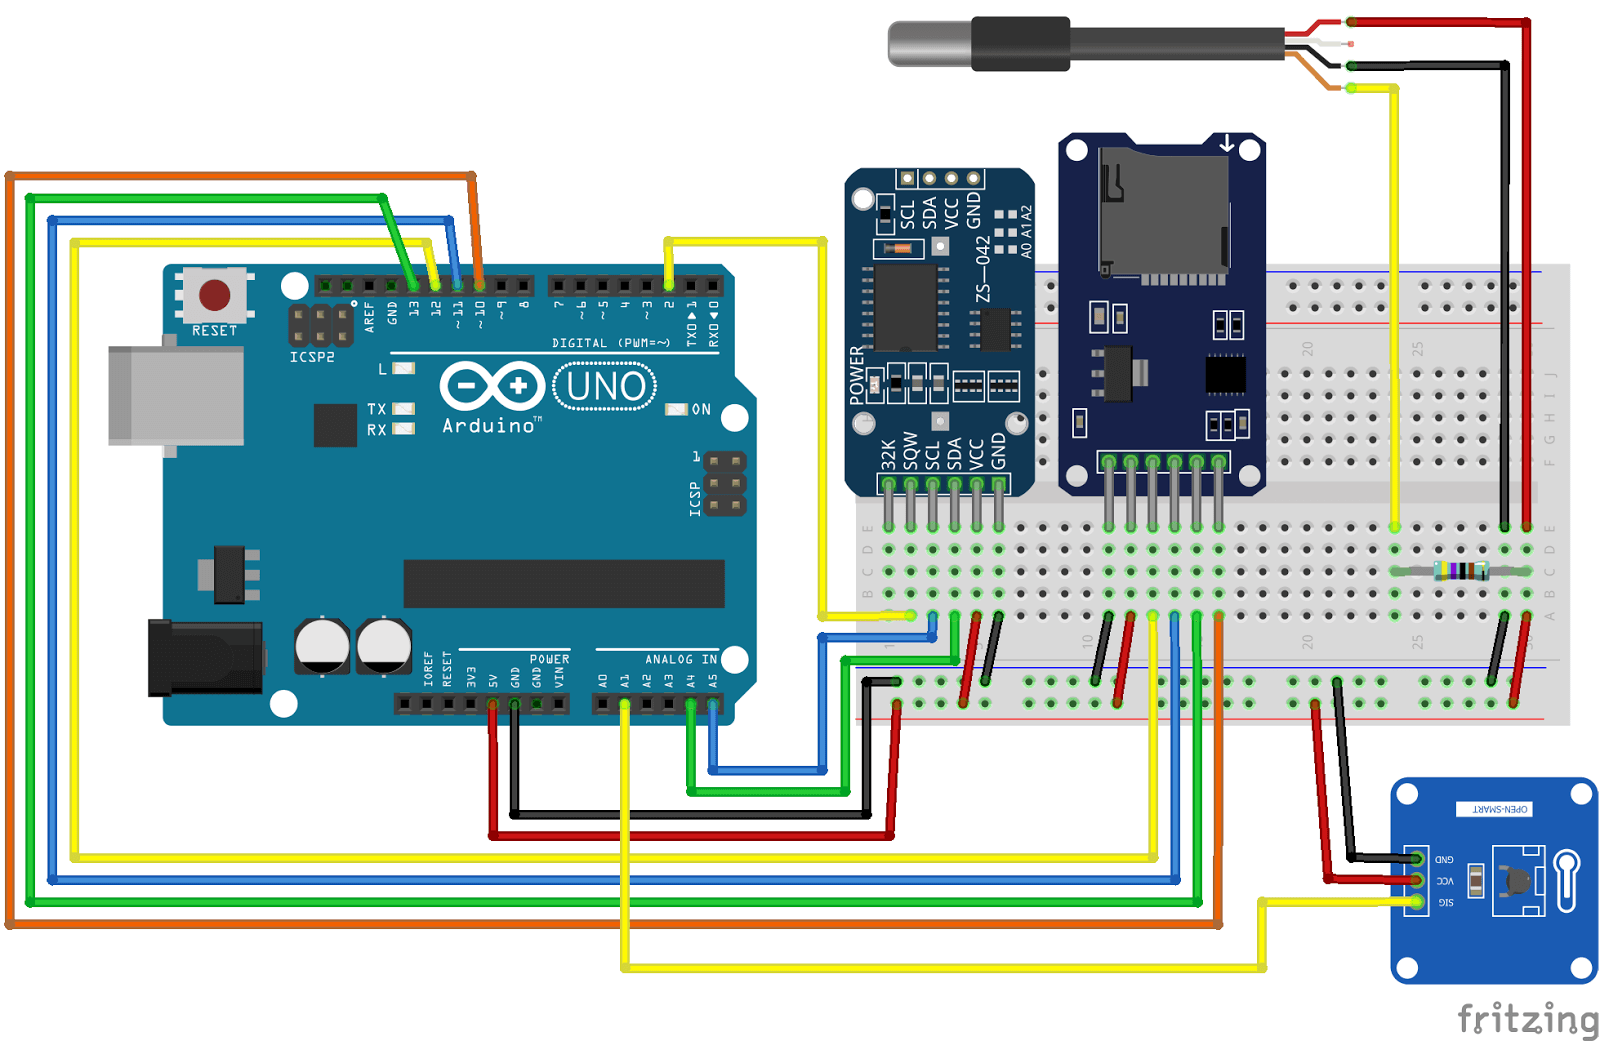
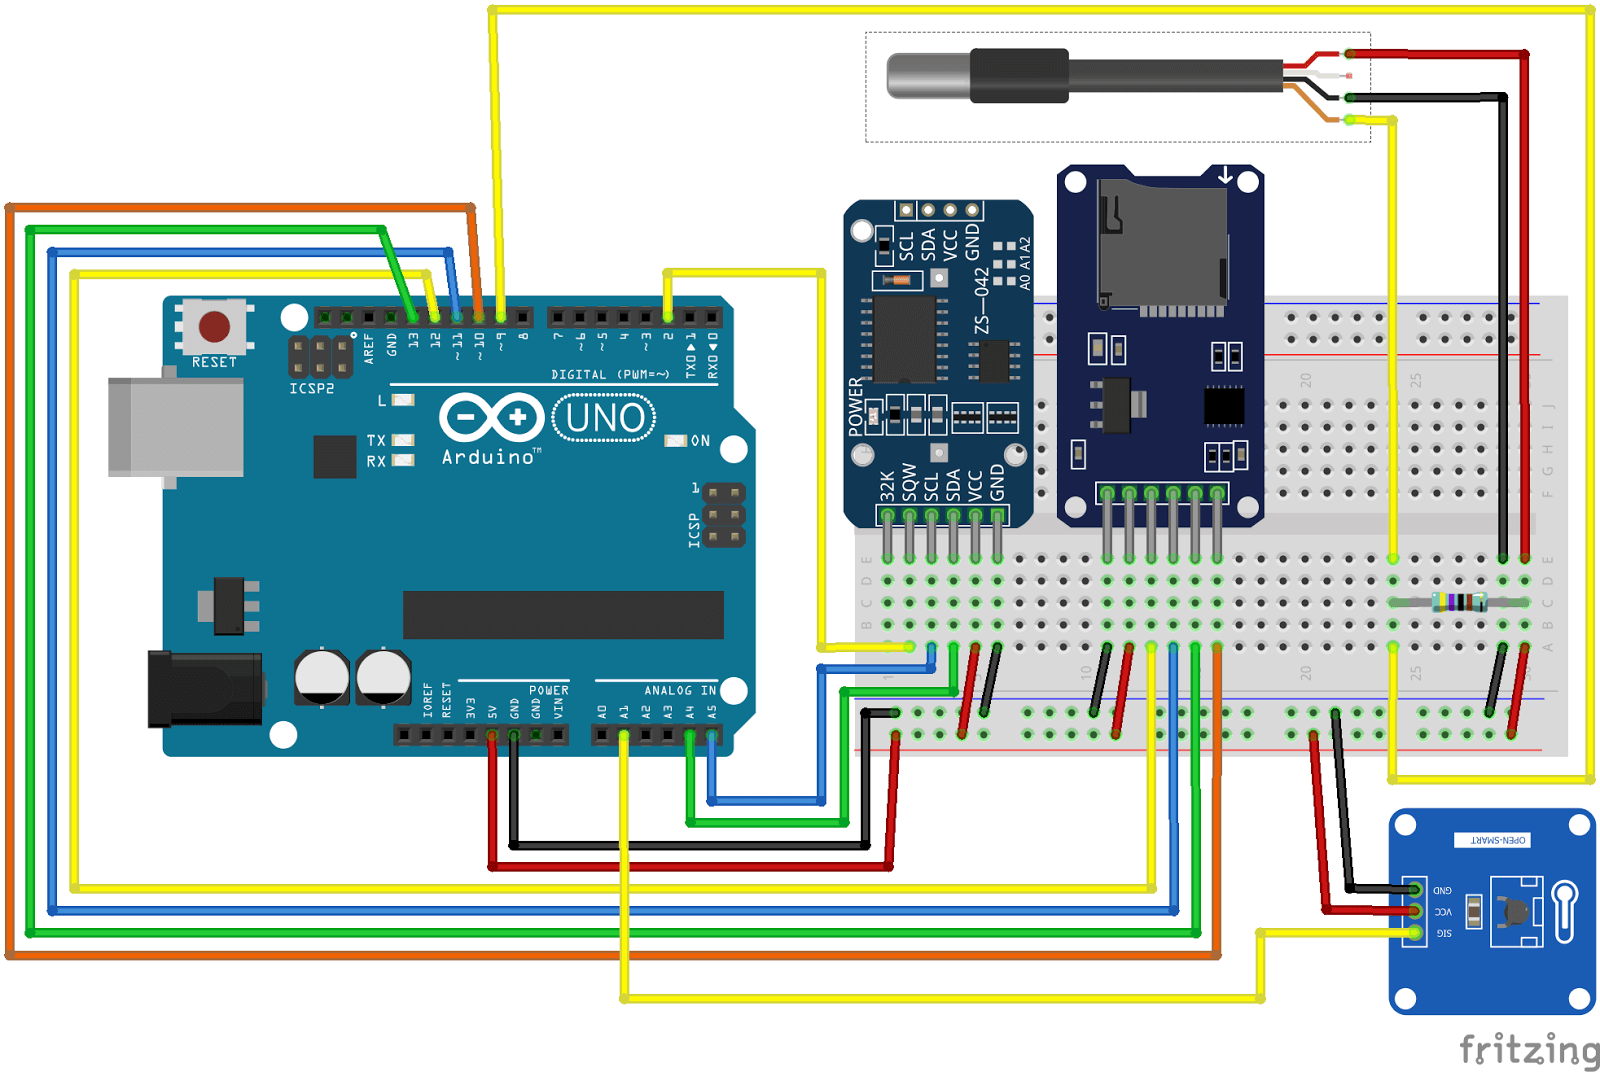
1Insert one end of a 4.7K Ohm resistor into C-24 on the breadboard. Insert the other end into C-30 on the breadboard. It does not matter which end is placed in the holes on the breadboard.
2Connect A-29 to the “-” power rail on the breadboard with a flat jumper wire. Connect A-30 to the “+” power rail on the breadboard with a flat jumper wire.
3Connect the waterproof thermometer’s black wire to E-29 on the breadboard. Connect the red wire to E-30 on the breadboard. Connect the yellow wire to E-24 on the breadboard.
4Use a jumper wire to connect A-24 on the breadboard to D9 on the Arduino.
Gathering Data
The RIFFLE is now wired. It will begin collecting data once the Arduino is connected to the computer and the sketch is uploaded to the board.
1Connect the Arduino to the computer with the USB cord. Open the Arduino IDE.
2Download the RIFFLE_v2.ino file and save it to a location on your computer.
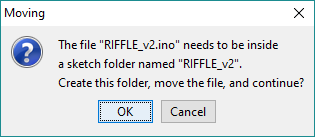
3Double-click and open the RIFFLE_v2.ino file. If prompted, click OK to create a sketch folder, move the file, and continue.
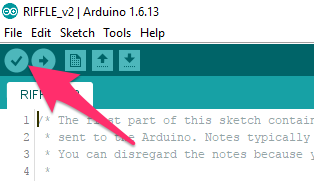
4Verify that the compiled code is error free by clicking the check mark button in the Arduino IDE.
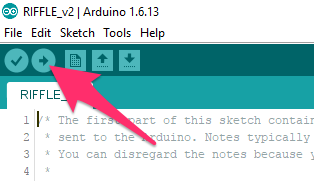
5Upload the code to the Arduino by clicking the arrow button in the Arduino IDE. Wait for the sketch to compile and upload successfully before going to Step 6.
6Open the serial monitor by clicking the magnifying glass button in the upper right corner of the Arduino IDE.
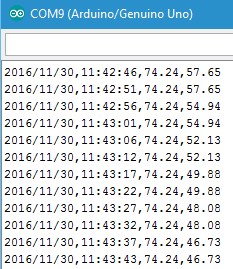
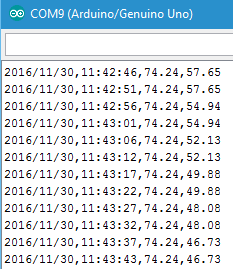
7Check the data stream to confirm that the you see a comma-delimited list that is similar to the image below. If you see data in the serial monitor, chances are good that it’s saving to the Micro-SD Card. However, it’s always good to double-check the Micro-SD Card before placing the weather station in the field.
Field Testing & External Power
When you upload the sketch, it stays on the Arduino and will automatically begin running when powered. There’s no need to bring your computer outside when testing; all of the data saves to the Micro-SD Card in a format that is readable later on. However, it’s best to unplug any power sources (e.g., USB cord) when transporting the RIFFLE to the testing location. Not doing so will make it difficult to precisely identify when the RIFFLE is measuring environmental conditions that matter!
Connect the 9V battery to the clip and power the RIFFLE when you are ready to collect data. This is best done when you are at the location where you will be testing. Leave it for a couple of hours (or longer).
Note
If the RIFFLE_v2.ino sketch is not modified, the RIFFLE will collect a timestamped reading from each sensor every 5 seconds. That means 12 measurements each minute, 720 each hour, etc… That’s a large data set which should be analyzed using a spreadsheet program like Google Sheets.
Google Sheets
Google Sheets is an online spreadsheet program. It offers a simple way to import data saved to a text file for projects like the RIFFLE. The data set can be analyzed once it’s imported into Google Sheets.
Note
This tutorial offers general suggestions for analysis but is not intended to be a complete walkthrough of Google Sheets and mathematical functions.
Transfer Text File to Google Sheets
The file on the RIFFLE’s Micro-SD Card must be transferred to Google Sheets in order to analyze the measurements. These steps only need to be completed once.
1Unplug the RIFFLE from its power source (computer or 9V battery).
2Remove the Micro-SD Card from the module on the RIFFLE.
3Insert the Micro-SD Card into a SD Card Reader.
4Insert the SD Card Reader into your PC.
5Navigate to the Micro-SD Card in the Windows browser. Drag DATA1.txt to your desktop or Documents folder.
6Open the DATA1.txt file that’s on the computer and confirm that it contains properly formatted, comma-delimited entries like the example below.
Note
CSV stands for comma-separated values. It’s a common file type that’s easily imported into spreadsheet programs. In the DATA1 file, each line represents a reading from the RIFFLE in the following format: Date, Time, Air Temperature, Water Temperature.
7Close the text file.
Import Text File to Google Sheets
There are a couple of ways to move data in a .csv file to Google Sheets. The steps below are the easiest to understand but are not necessarily the most efficient in terms of the number of steps.
1Open a browser (e.g., Google Chrome) on your computer.
2Sign into a Google Account.
3Navigate to Google Drive.
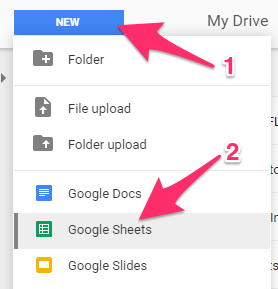
4Click the blue New button and select Google Sheets.
5Name the Google Sheet so that it’s easy to locate. Click in the title area to rename the file to something other than Untitled Spreadsheet.
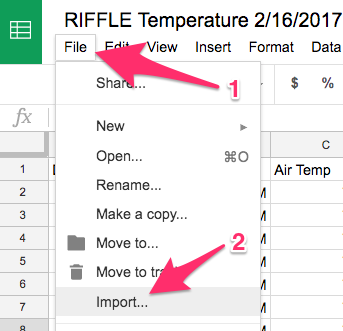
6Go to File and then select Import…
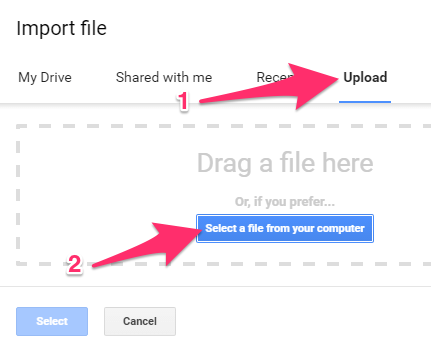
7Choose the Upload tab and then press the blue Select a file from your computer button. Navigate to DATA1.txt on your computer. Once located, press the Open button.
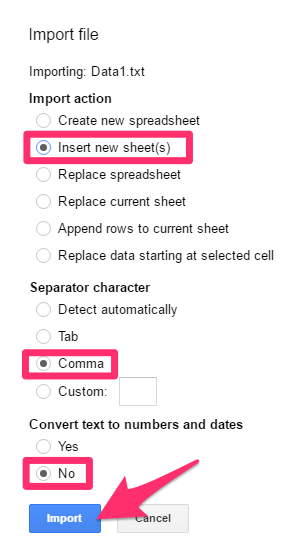
8A new window opens. Make sure that you choose the options below. When you are finished, press the blue Import button.
Formatting Data in Google Sheets
A few formatting changes must be made before analysis. These alterations make the data manipulatable and easier to understand.
Header Row
A header row is a list of labels that describes all of the content in each column. Header rows provide immediate, visual organization to the data set, and they also clarify data when producing charts, graphs, and pivot tables.
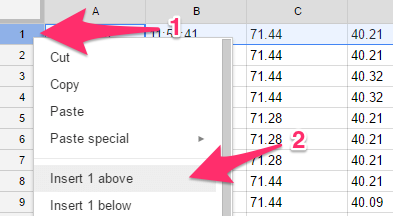
1Right-click on Row 1 and select Insert 1 above.
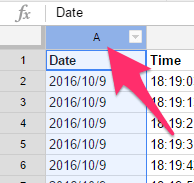
2Add column titles by typing descriptive labels in the new row. Copy the titles in the image.
Date
The data in the Date column needs to be formatted so that it’s a number and not just text. The cells might look like they contain dates, but they’re actually text fields.
1Click on the A column to select all of the data in that column. You will know all of the cells are selected if there’s a light blue hue.
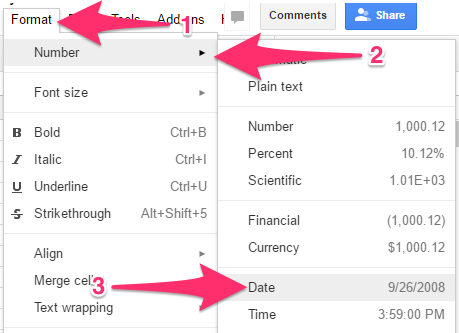
2With the column selected, go to Format → Number → Date.
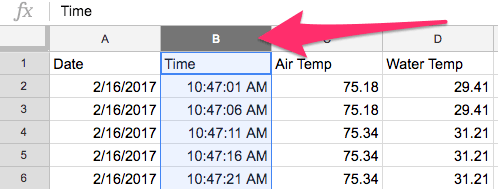
Time
The data in the Time column needs to be formatted so that it’s a number and not just text. The cells might look like they contain time entries, but they’re actually text fields.
1Click on the B column to select all of the data in that column. You will know all of the cells are selected if there’s a light blue hue.
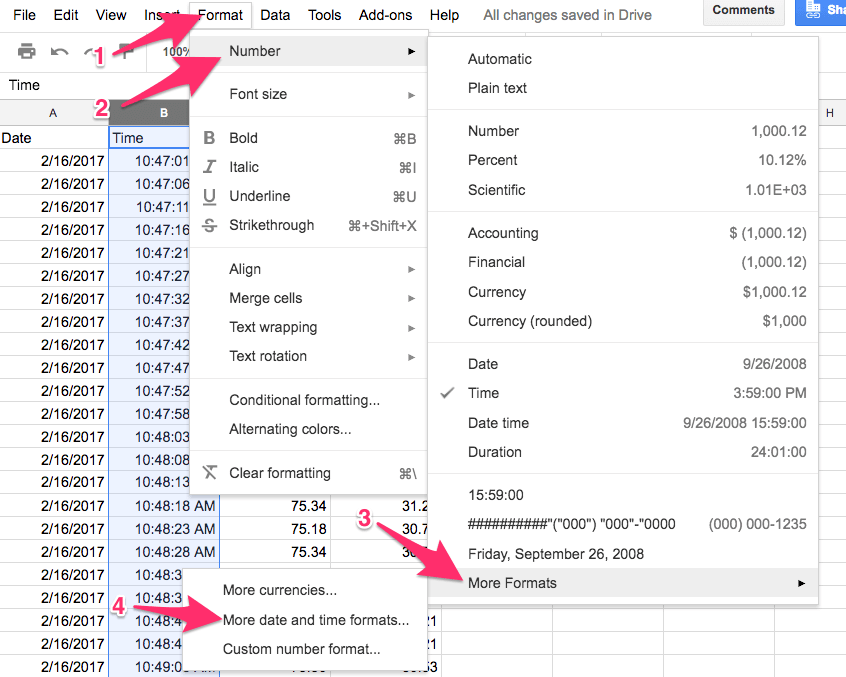
2With the column selected, go to Format → Number → More Formats → More date and time formats…
3Select a format that has only Hour:Minute:Second and then press the blue Apply button. See example below.
Air Temp & Water Temp
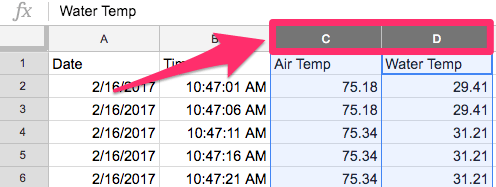
The data in the Air Temp and Water Temp columns needs to be formatted so that each one contains numbers instead of text. The cells might look like they contain numbers, but they’re actually text.
1Select columns C-D. You will know all of the cells are selected if there’s a light blue hue.
2With the columns selected, go to Format → Number → Number.
Analyzing Data in Google Sheets
There are a number of ways to analyze data once it’s in Google Sheets. Some involve manipulating numbers while others produce graphs and charts for visually representing the data set.
Charts & Graphs
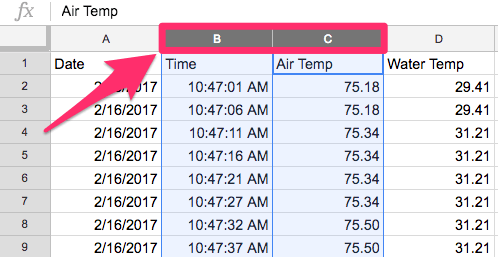
1Select the columns (ctrl+click or cmd+click) that contain the data that you want to analyze.
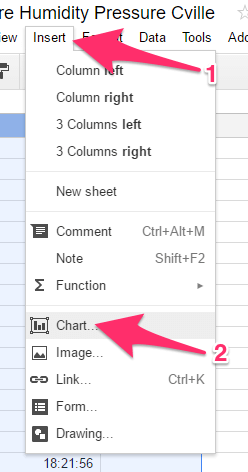
2Go to Insert → Chart.
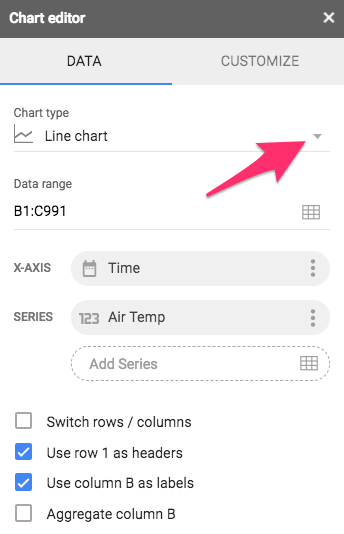
3Use the Chart editor to change the way the data is displayed in the chart. Explore the drop-down list beneath Chart type for more visualization options.
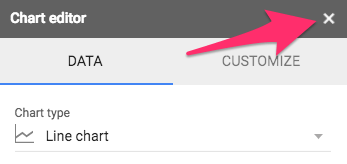
4Close the Chart editor by clicking the white X in the upper-right corner.
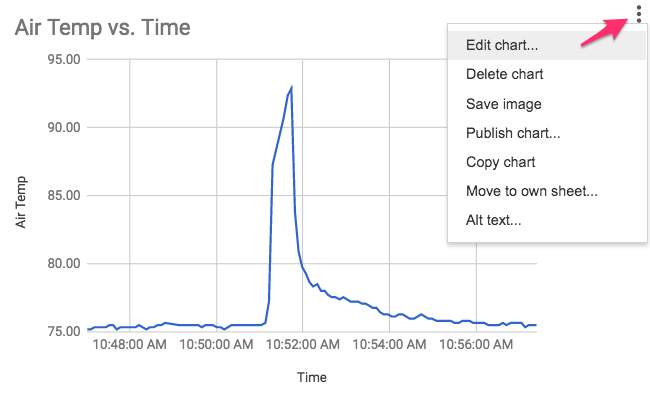
5Click on an existing chart or graph and then select the “three dots” to change options or return to the Chart editor.
Pivot Tables
A pivot table is a tool that lets you perform common calculations (mean, max, min, etc…) on a data set. Creating pivot tables takes some practice, so plan on spending some time learning how to effectively use this tool.
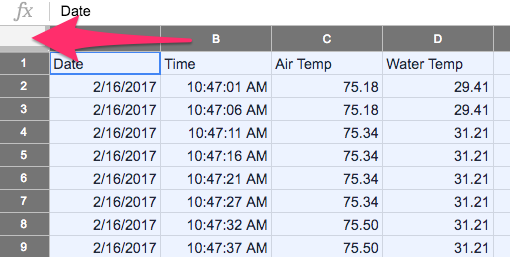
1Select all of the data in the active sheet by clicking on the intersecting box where the row and column headers meet.
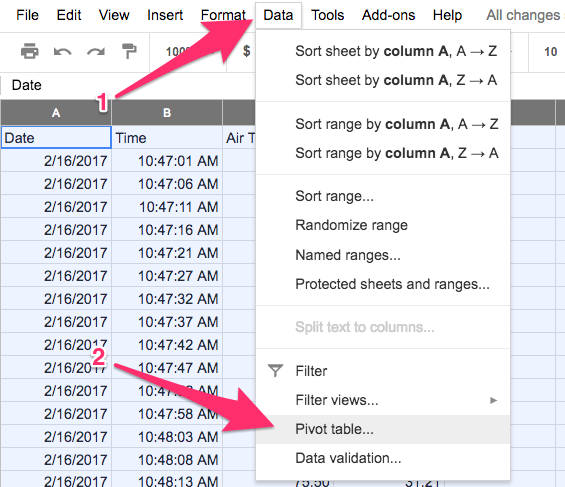
2Go to Data → Pivot Table… This opens a new sheet in the current workbook.
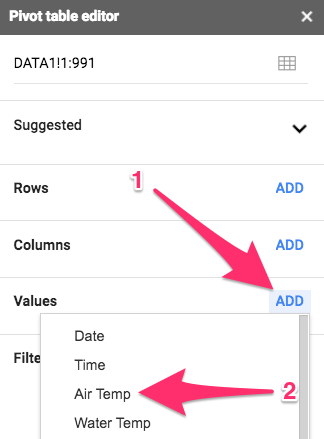
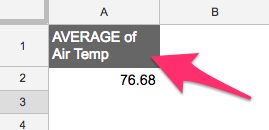
3In the Pivot table editor, click the blue Add link next to Values and choose Air Temp (example).
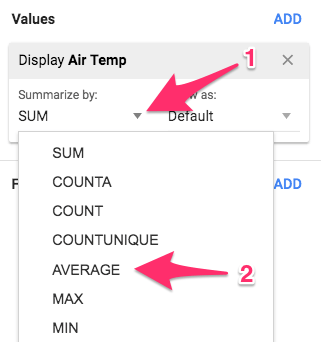
4Click on the drop-down list beneath Summarize by and choose AVERAGE (example).
5The pivot table automatically computes the mathematical operation on the selected data (e.g., AVERAGE of Air Temp) and shows it in the active sheet. Click anywhere in the table to return to the Pivot table editor and add a new computation.
6Switch between the Pivot Table 1 and DATA1 sheets by clicking on the tabs at the bottom of the page.
Explore
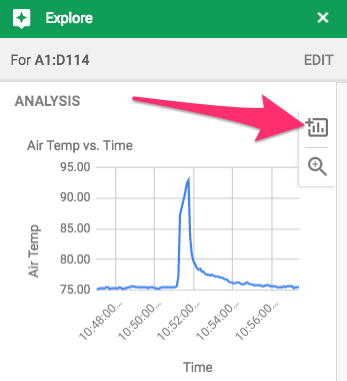
The Explore tool lets you visualize your data based on what Google thinks is the most interesting comparisons and computations. While simple to use, it lacks the customization that a pivot table or chart provides.
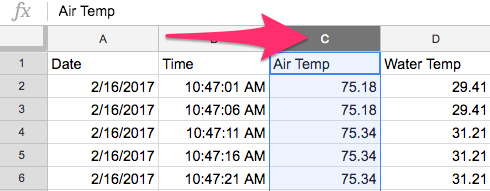
1Select a column (e.g., Air Temp) that contains the data that you want to analyze.
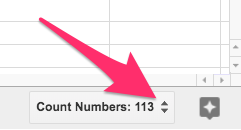
2Click on the drop-down list in the lower-right corner to view mathematical computations for the selected column.
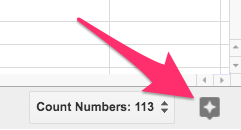
3Click on the Explore button to view graphs and charts.
4In the Explore tool, hover over a chart or graph and click the Insert chart button to add the visualization to the active sheet.
Mathematical Formulas
Google Sheets lets users perform mathematical formulas in a way that is very similar to Microsoft Excel. Formulas allow you to perform calculations on a specific range of numbers.
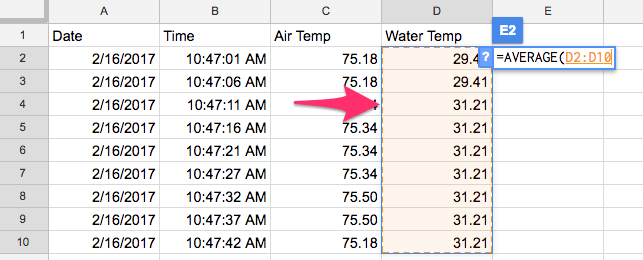
1Find an empty cell in the DATA1 sheet, type an equal sign (=), and then begin typing the formula that you want to use (e.g., AVERAGE).
Common Mathematical Formulas
- AVERAGE = Average
- SUM = Sum
- MIN = Minimum Value
- MAX = Maximum Value
- MEDIAN = Median Value
- COUNTA = Number of Values in a Range
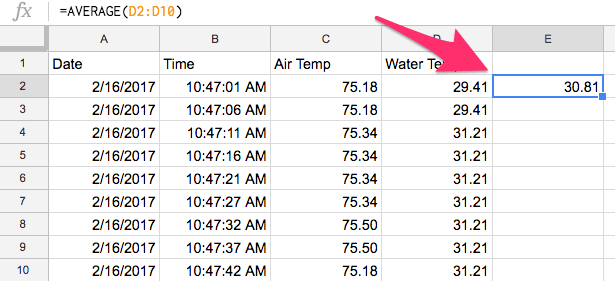
2Click on the formula from the tooltip list and then select a range of values in the DATA1 data set (e.g., Water Temp: D2-D10).
3Click the Enter/Return key on your keyboard to perform the calculation. Repeat the previous steps with different mathematical formulas in other empty cells.
License
The content and images in this tutorial are protected by a CC BY-NC-ND 4.0 License. Please contact Willy Kjellstrom with questions about reuse or modifications.
References
Breadboard Cutaway Image: Predko, M. (2015). Arduino for makers #1: Setting up a development station. Robohub. Retrieved January 27, 2018.


